
Figure 5. Knockdown of SRA in 3T3-L1 mature adipocytes is associated with downregulation of IR protein content and downstream insulin signaling pathway phosphorylation events.
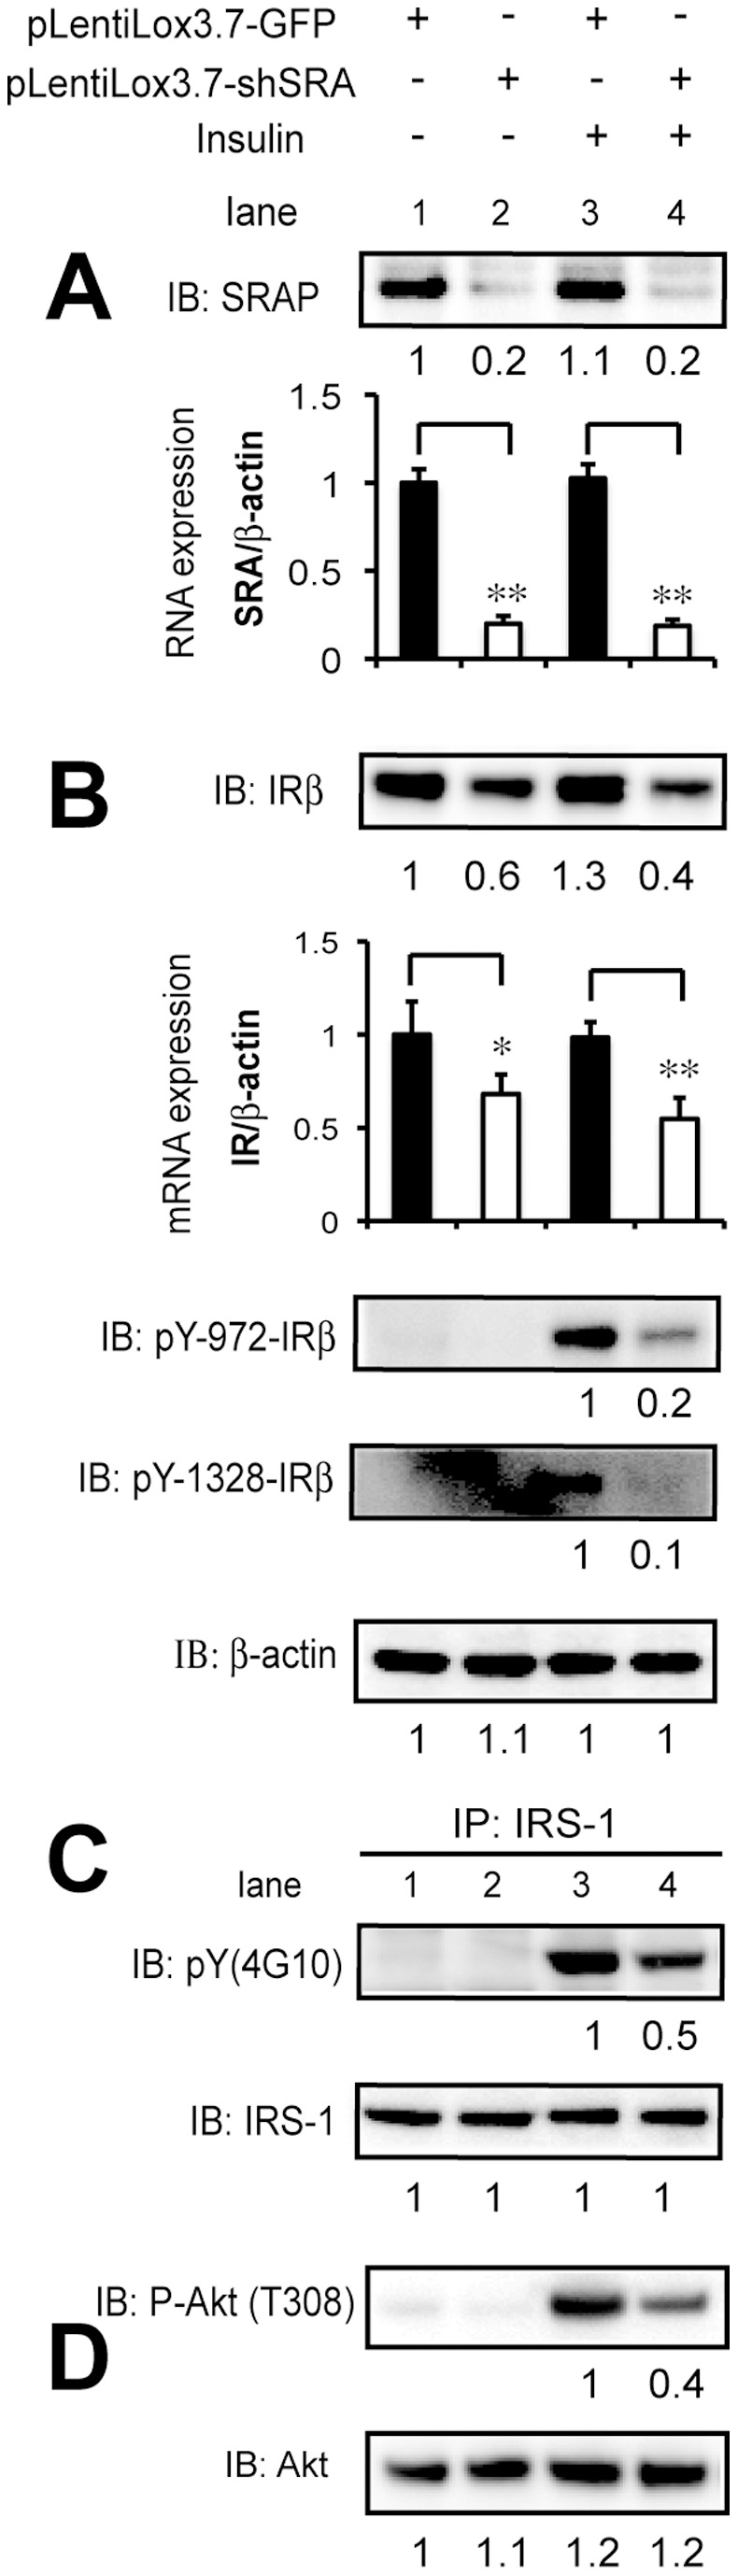
3T3-L1 adipocytes at day 6 post-induction with MDI were infected with lentivirus expressing control (pLentiLox3.7-GFP) or SRA knockdown shRNA (pLentiLox3.7-shRNA). At day 11 post-MDI, adipocytes were starved for 12 h and treated without or with 10 nM insulin for 20 min. A, To confirm effective knockdown of endogenous SRA, an immunoblot was probed with an anti-SRAP specific antibody, and RT-qPCR was performed for SRA expression that was normalized to β-actin. B, Gene expression of IR at each condition analyzed by RT-qPCR and was normalized to the expression of β-actin. Immunoblots were subsequently performed on cell lysates from control or SRA -depleted adipocytes using antibodies as indicated. C, Similar to Figure 5A, serum-starved day 11 adipocytes were treated with or without insulin, cell lysates were first applied to immunoprecipitation for anti-IRS-1, followed by immunoblotting for anti-tyrosine (4G10). D, Immunoblots were performed for cell lysates indicated in A using Akt phospho- or total- antibodies. A–D, Quantification of each band was performed using a Bio-Rad Fluor-S MAX MultiImager. For IRβ, β-actin, IRS-1 and Akt, the signal of each band was compared to that for control cells without insulin treatment (for which the level of expression was set at 1). For tyrosine phosphorylation of IRβ and IRS-1 (pY-) and phospho-Akt, band intensity was set at 1 for insulin-treated control cells. These results are representative of three independent experiments.