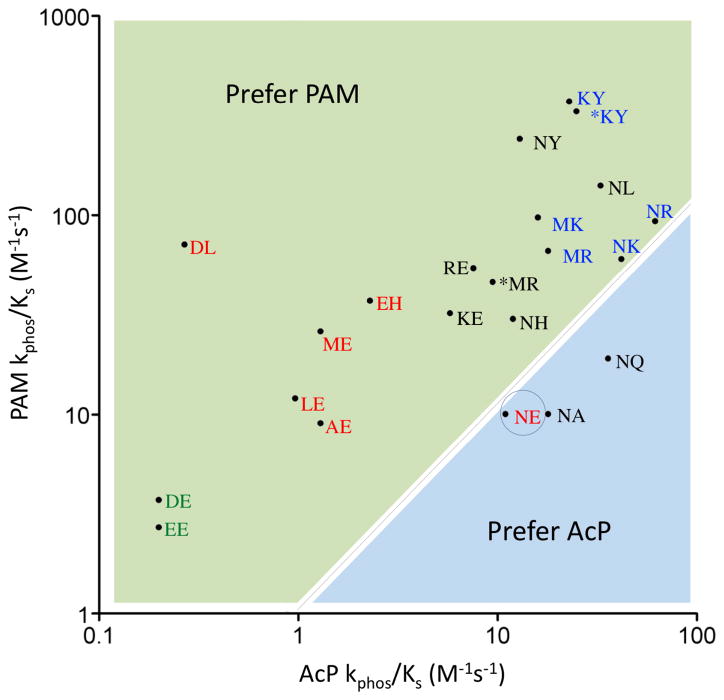
Figure 2.
Phosphodonor preference (PAM versus AcP) for the set of CheY variants studied. For each CheY variant, the position of the point reflects the logarithms of the kphos/KS values (Table 1) for reaction with AcP (abscissa) or PAM (ordinate). CheY variants are designated by the amino acids at positions D+2 and T+2, respectively with wild type CheY (NE) circled. *KY and *MR have additional substitutions at DD+1 (F14Q and F14E) to mimic the Spo0F and PhoB response regulators respectively. Designations are color coded to reflect the net charge of residues at positions DD+1, D+2, and T+2 with net charge = +1 (blue), 0 (black), −1 (red), and −2 (green). The black dotted line (slope = 1) separates the plot into regions that prefer PAM (light green) or prefer AcP (light blue).

