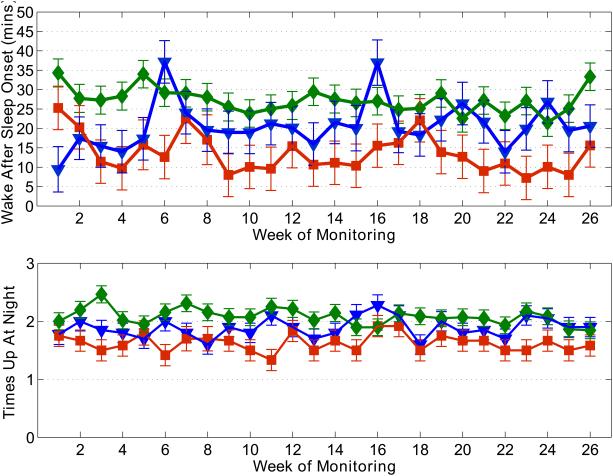
Figure 1.
Example of the 26-week longitudinal data across groups. Group means were calculated from the median of the daily measures for the week for each volunteer. Green diamonds: intact volunteers; red squares: aMCI; blue triangles: naMCI. Top plot: wake after sleep onset; bottom plot: times up at night. Statistical significance bars calculated using the pooled variance across weeks for each group.

