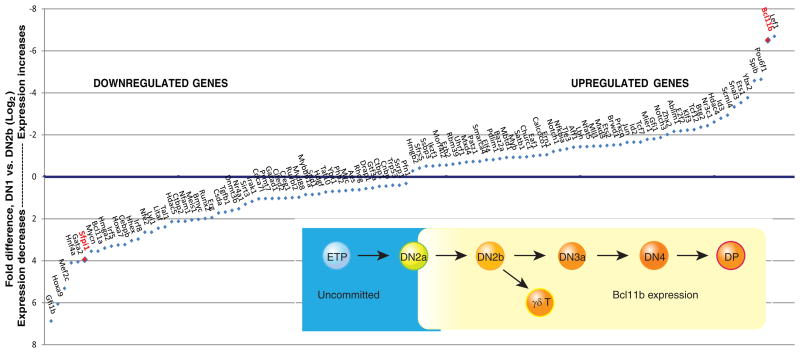
Figure 2.
Transcription factors that change expression during commitment. Main panel: genes encoding transcriptional regulators that change most in expression between ETP/DN1 stage and newly committed DN2b stage, with fold changes measured by genome-wide RNA-seq analysis (Zhang et al. 2012). Genes annotated as regulatory genes with largest fold decreases in expression or increases in expression (DN2b/DN1 levels <0.5 or >2, FDR<0.05) are arranged on x axis in order of fold change. Values on y axis are log2-transformed ratios of (expression in DN1)/(expression in DN2b). Axis order is set to show downregulated genes below the x axis and upregulated genes above the x axis. PU.1 (Sfpi1) and Bcl11b are highlighted by red labels. Inset: schematic depiction of expression pattern of Bcl11b as defined at the single-cell level by expression of a Bcl11b-IRES-mCitrine fluorescent protein reporter allele described in text (H.Y.K. and E.V.R., unpublished data).

