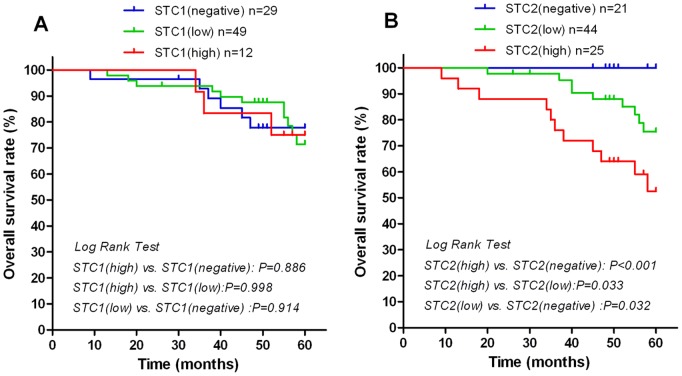
Figure 5. Survival rates according to STC1 or STC2 expression in LSCC patients.
The overall survival rate according to STC1 (A) or STC2 (B) expression was plotted by the Kaplan-Meier method. Differences among the three groups (negative, low, or high expression of STC1 or STC2) were evaluated by the log-rank test. Patients with high STC2 expression in tumor tissues had significantly poorer overall survival rates than that of patients with negative or low STC2 expression in tumors.

