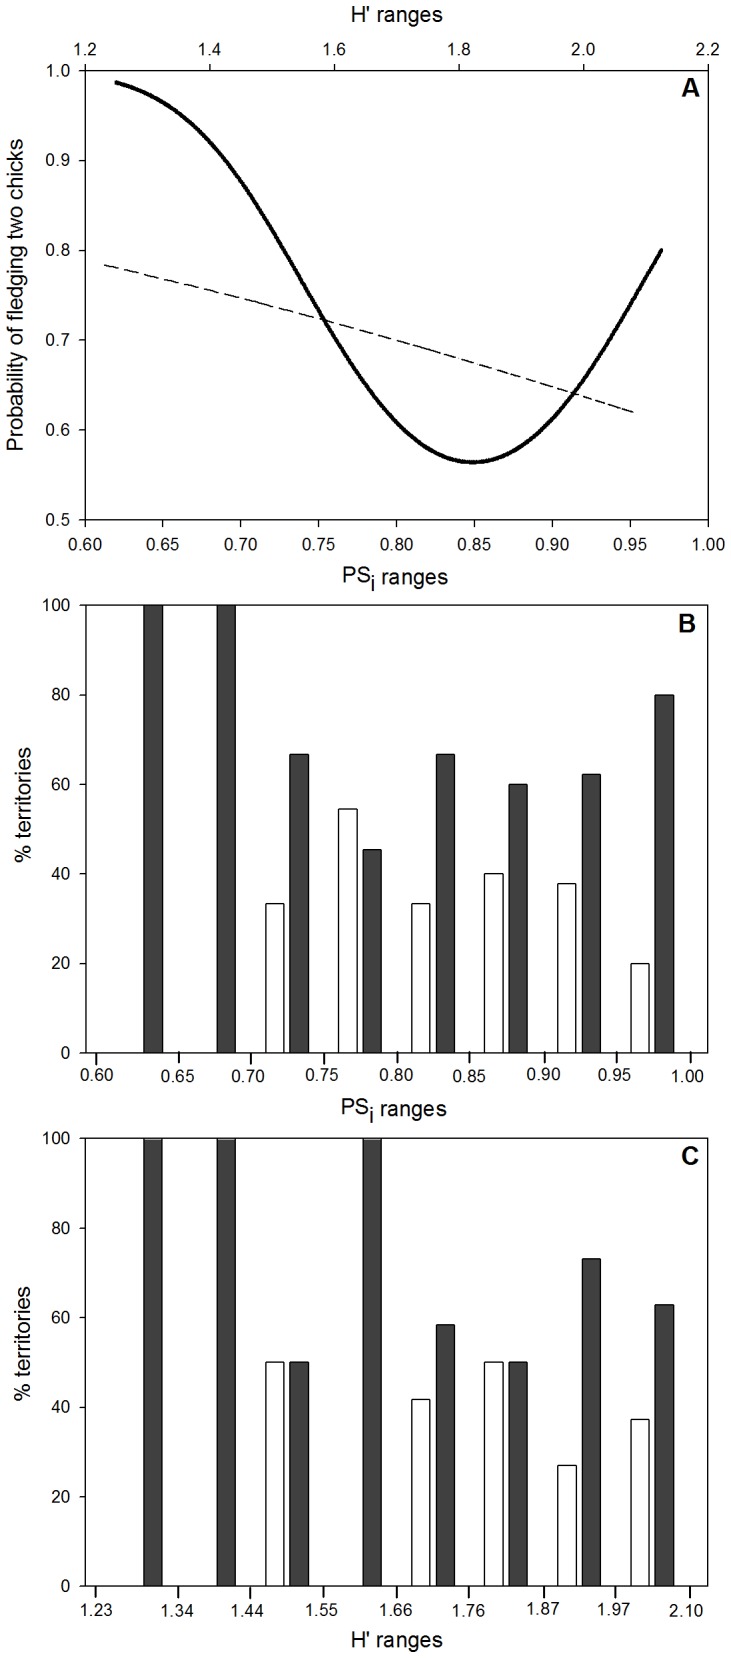
Figure 4. Responses of the second and third best models based on the GLMM approach.

The productivity of successful breeding pairs (i.e. probability of producing two chicks instead of one) was the response variable, and age of breeding pairs, individual replacement, nestling prey consumption specificity (PSi) or diet diversity (H′) are the explanatory variables. The graphic (A) represents the modeled probability of fledging two chicks (y-axis, probabilities between 0.5 and 1.0) if only considering adult pairs with no individual replacement, and using the range of observed PSi values (solid line and lower x-axis, PSi between 0.62 and 0.97) or H′ values (dashed line and upper x-axis, H′ between 1.23 and 2.08). The graphics (B and C) shows the real data used in the GLMM, with the x-axis representing PSi (B) or H′ (C) values of each territory, and the y-axis the proportion of territories fledging one (light bars) or two (dark bars) chicks.
