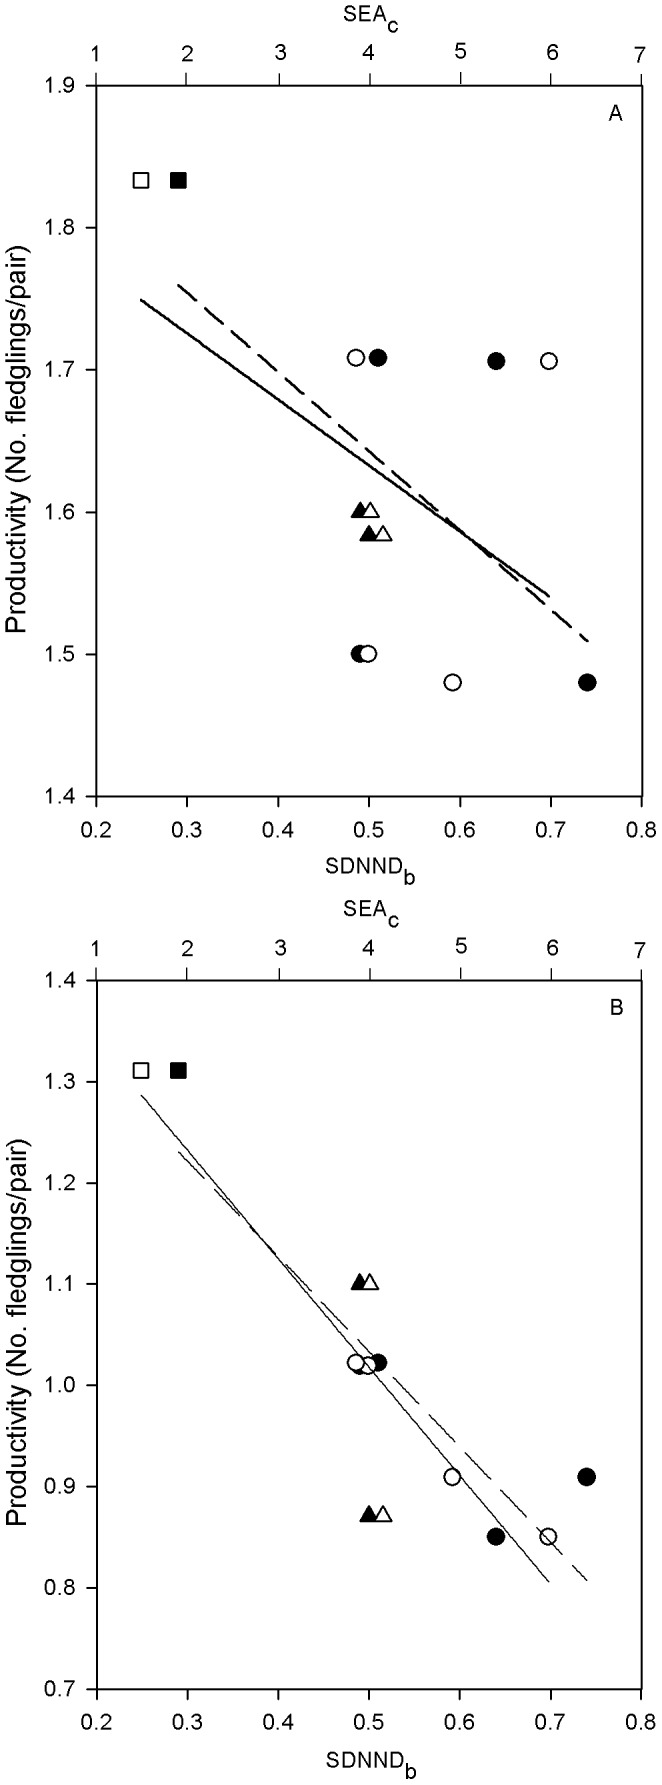
Figure 5. Correlations between mean productivity and both the SEAc and the SDNNDb at the population-year level.

Mean productivity refers to A) only successful pairs and B) the whole monitored population (either successful or not successful breeding pairs). In both cases, the upper x-axis shows the SEAc (corrected standard ellipse area; open symbols), and the lower x-axis shows the SDNNDb (standard deviation of nearest neighbour distance bootstrapped; filled symbols). Trend lines of the relationship between productivity and either SEAc (solid line) or SDNNDb (dashed line) are shown. Different symbol shapes represent France (triangles), Catalonia (circles) and Andalusia (squares).
