
Figure 4.
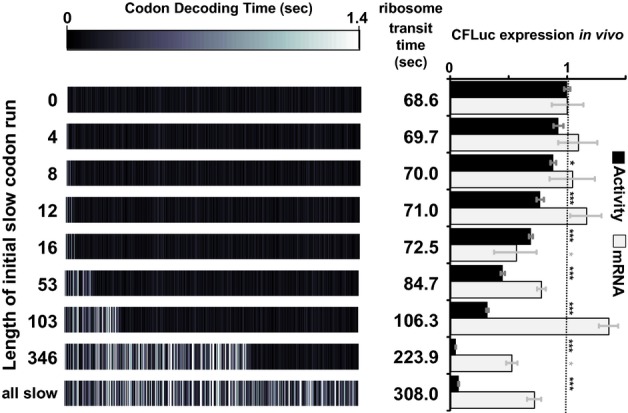
Expression levels are compared for derivatives of the maxCFLuc sequence (topmost construct), which consists only of the fastest possible codons. The 5′-end of this sequence was replaced by minCFLuc DNA, which consists only of the slowest possible codons. Replacement of as few as eight codons at the CFLuc 5′-end significantly affects luciferase activity levels, without significantly affecting mRNA levels. In contrast, replacement of the last 201 codons has no additional effect if the preceding codons are already slow (compare expression from the ‘346′ and ‘all slow’ constructs. The ‘all slow’ construct is identical to minCFLuc). ‘Transit Time’ denotes the time required by one isolated ribosome to translate the respective construct, and was calculated as the sum of the mean codon decoding times. The bars and error bars denote the mean and standard error of the mean for luciferase activity (n = 8) and luciferase mRNA levels (n = 3). Statistical significance of difference to the topmost (0 slow codons) construct was tested using Tukey's Test following one-way ANOVA, with parameters for luciferase activity: n = 8, F = 239.65, P = 0; for mRNA: n = 3, F = 6.96, P = 4 × 10⁻⁶. Statistical significance is indicated by asterisks: *, P < 0.05; **, P < 0.01; ***, P < 0.001, no asterisk, P > 0.05. The primer design strategy developed to compare the different codon variants is described in the supplemental information.