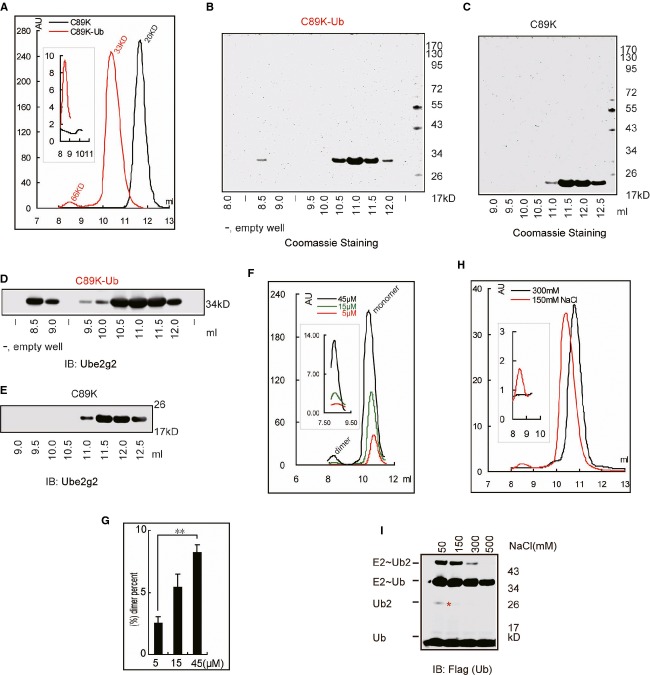
Figure 5.
Electrostatic interaction(s) between two Ube2g2˜Ub molecules.
A Ube2g2 and Ube2g2∼Ub proteins (300 μl 30 μM) were analyzed by size-exclusion chromatography with Superdex 75 10/300GL. The inlet shows an enlarged view of the dimer peak.
B, C Protein fractions from the size-exclusion chromatography experiment were analyzed by SDS-PAGE and Coomassie blue staining. Note that the protein fractions containing Ube2g2 monomer were two-fold diluted before SDS-PAGE analysis.
D, E Samples in (B) and (C) were analyzed by Western blotting with anti-Ube2g2 antibody (Note: The protein fractions containing Ube2g2 monomer were 10-fold diluted before SDS-PAGE analysis.
F, G The equilibrium state of monomer/dimer form of Ube2g2˜Ub was analyzed by size-exclusion chromatography (F) with Superdex 75 10/300 GL using 200 μl 5, 15 and 45 μM Ube2g2˜Ub and the dimer form Ube2g2˜Ub was quantified (G), the percentage of dimer form Ube2g2˜Ub was calculated as: 100 x. Area under dimer/(dimer + monomer) peak (**P < 0.01).
H Size-exclusion chromatography analysis of purified Ube2g2-Ub (150 μl 15 μM) proteins at different concentrations of salt. The inlet shows an enlarged view of the dimer peak. A small shift of the monomeric peak under the high salt condition was seen, which might result from a minor conformational change due to high salt.
I Effect of salt on Ube2g2-catalyzed di-ubiquitin formation in the absence of E3. Ube2g2 was incubated with E1, FLAG-tagged ubiquitin and ATP in the presence of the indicated concentrations of salt for 30 min. The asterisk indicates di-ubiquitin reduced from the active site.
Source data are available online for this figure.

