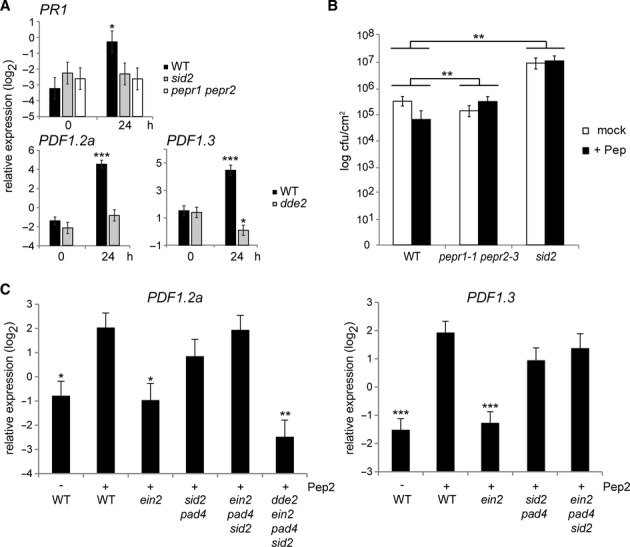
Figure 3.

- qRT-PCR analysis for the indicated SA and JA marker genes in 10-day-old seedlings treated with 1 μM Pep2 for the indicated times.
- Leaves of 4-week-old plants pretreated with a mixture of Pep2 and Pep3 (1 μM each, +Pep) for 1 day were syringe-inoculated with Pst DC3000 (1 × 10⁵ cfu/ml). The bacterial titer ± SD at 3 dpi is shown. Student's t test and Benjamini–Hochberg method was carried out to determine the significance of the difference in the induced resistance between the mutant and WT plants.
- qRT-PCR analysis for the JA markers in 10-day-old seedlings with or without Pep2 (1 μM) for 24 h.
Data information: For qRT-PCR analysis (A and C), bars represent means and SE of at least three biological replicates calculated by the mixed linear model. On the vertical axis, shown are the log2 expression levels relative to that of At4g26410. Asterisks indicate significant differences from the value of the corresponding genotype at 0 h (A) or those from the value in Pep-treated WT plants (C) (*q < 0.05, **q < 0.01, ***q < 0.001, two-tailed t-tests).
