
Figure 5.
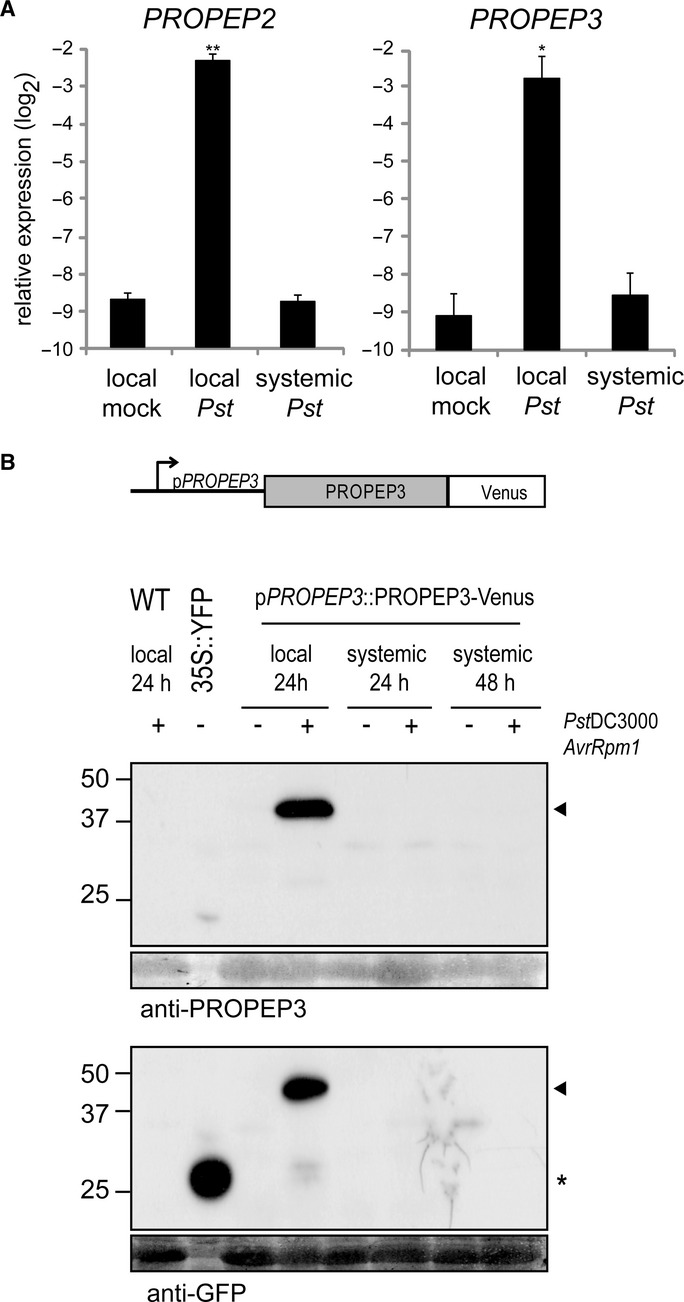
PROPEP2 and PROPEP3 predominantly accumulate in local tissues during systemic acquired resistance.
- qRT-PCR analysis for PROPEP2 and PROPEP3 in local and systemic leaves 24 hpi with Pst DC3000 (105 cfu/ml) in 4-week-old plants. Bars represent means and SE of two biological replicates calculated by the mixed linear model. On the vertical axis, the log2 expression levels relative to that of At4g26410 are shown. Asterisks indicate significant differences from mock-treated plants (*q < 0.05, **q < 0.01, two-tailed t-tests).
- The construct used for the generation of stable transgenic plants expressing PROPEP3-Venus protein under the control of the native regulatory DNA sequences. Local and systemic leaves of 4-week-old plants at 24 or 48 hpi, respectively, with Pst DC3000 AvrRpm1 (107 cfu) were subjected to immunoblot analysis with anti-PROPEP3 or anti-GFP antibodies. Non-transformed Arabidopsis plants (WT) and N. benthamiana plants transiently expressing free YFP (35S::YFP) were used as controls. The lower panels below the immunoblots show the immunoblot membranes stained with Coomassie Brilliant Blue for verifying equal loading of the Arabidopsis protein samples. The arrowheads indicate the positions of the PROPEP3-Venus protein bands, and the asterisk indicates the position of the free YFP protein.