
Figure 7.
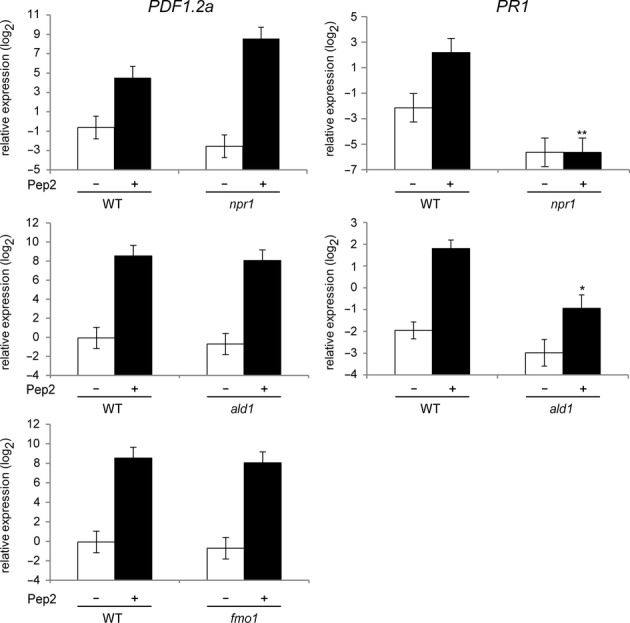
The roles for previously defined SAR regulators in Pep-induced systemic immune responses.
qRT-PCR analysis for PDF1.2a and PR1 in systemic leaves of 4-week-old plants upon 1 μM Pep2 application for 24 h. Bars represent means and SE of at least three biological replicates calculated by the mixed linear model. On the vertical axis, the log2 expression levels relative to that of At4g26410 are shown. Asterisks indicate significant differences from Pep-treated WT plants (*q < 0.05, **q < 0.001, two-tailed t-tests).