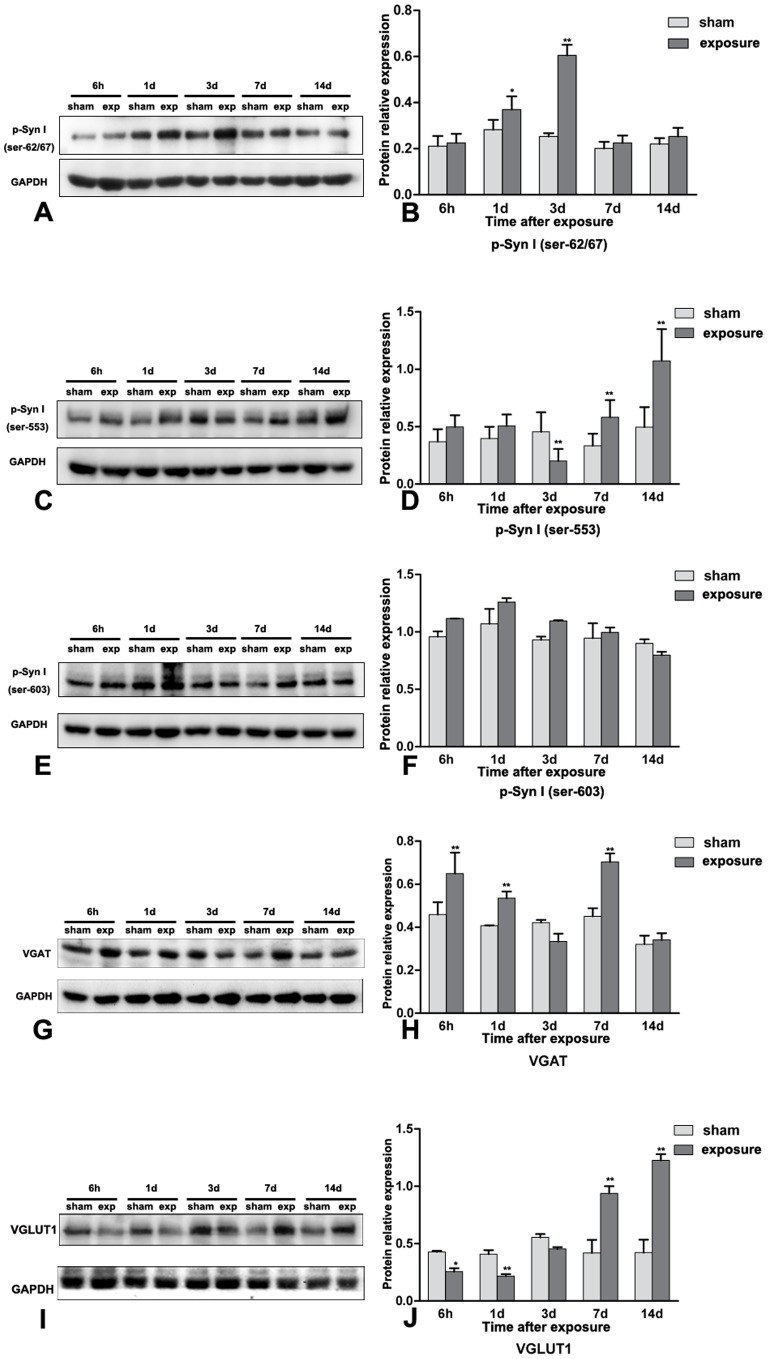
Figure 4. Protein expression diversity of p-Syn I, VGAT and VGLUT in Wistar rats after microwave exposure.
4A and 4B, p-Syn I(ser-62/67) protein expression was increased significantly at 1 day and 3 day after the exposure (P<0.05 and P<0.01, respectively); 4C and 4D, the expression of p-Syn I (ser-553) was decreased at 3 day after the exposure (P<0.01) with subsequent elevated protein expression at 7 day and 14 day (both P<0.01). 4E and 4F, no protein expression variation was observed for p-Syn I (ser-603). 4G and 4F, VGAT protein expression was significantly elevated at 6 hour, 1 day and 7 day after exposure. 4I and 4J, VGLUT1 was found down-regulated at the beginning (6 hour and 1 day) with significant up-regulation at 7 day and 14 day. Data represent mean ± SD. *P<0.05 versus sham group. **P<0.01 versus sham group.

