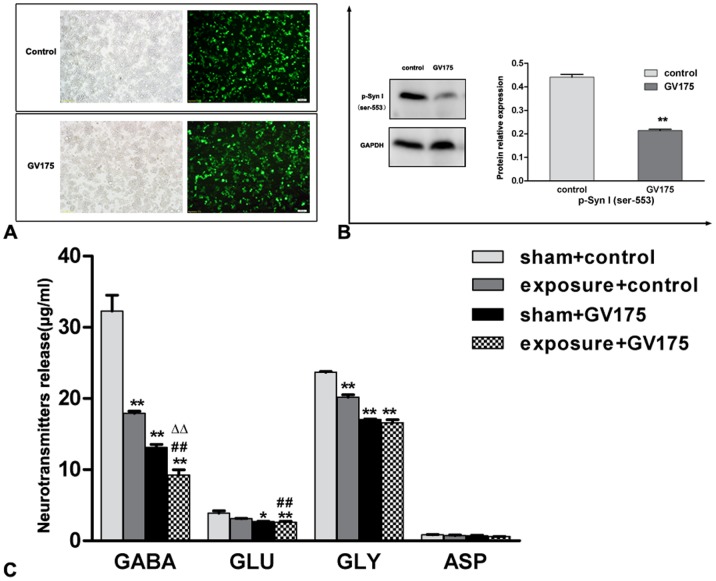
Figure 7. P-Syn I silencing resulted in the reduction of GABA release.
(A) Bright field and fluorescence micrographs demonstrating transfection of synapsin I shRNA (green). (B) Protein expression of p-Syn I (ser553) was decreased after silencing of the Synapsin I gene. (C) The release of GABA, glutamate (GLU), glycine (GLY), and aspartate (ASP) was measured by HPLC at 6 hours after microwave exposure, with and without silencing (GV175) and control, respectively. The release of GABA and other neurotransmitters were significantly attenuated after microwave exposure and p-Syn I silencing. Data represent mean ± SD. *P<0.05 versus sham+control group, ** P<0.01 versus sham+control group; ## P<0.01 versus expose+control group. ΔΔ P<0.01 versus sham+GV175 group.

