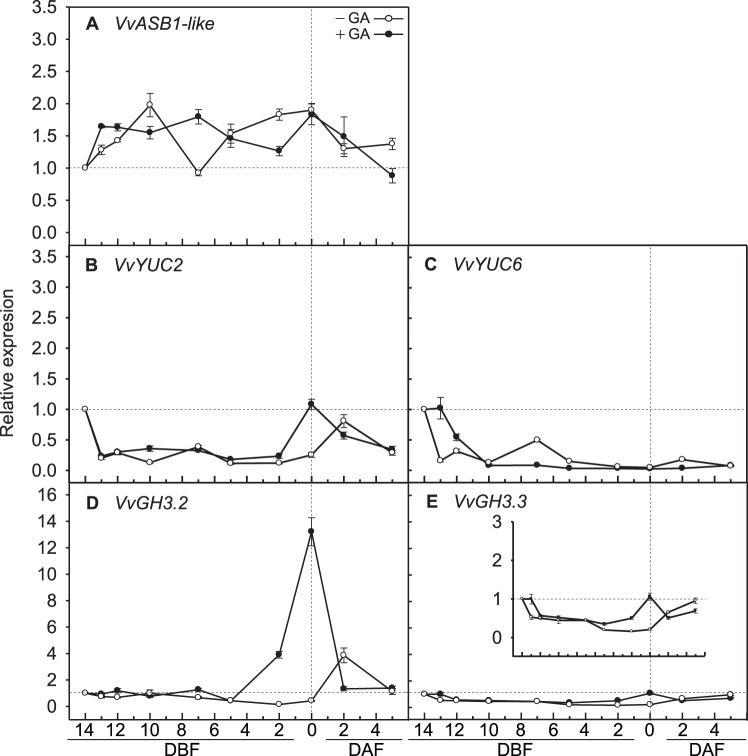
Figure 3. Transcriptional changes in auxin biosynthesis genes (A, B, and C) and early auxin-responsive genes (D and E).
(A) VvASB1-like, (B) VvYUC2, (C) VvYUC6, (D) VvGH3.2, and (E) VvGH3.3 in grapevine inflorescences with and without GA application. The expression level of VvGH3.3 is magnified in the insets. DAF, days after full bloom; DBF, days before full bloom. Quantitative reverse transcription-PCR was performed to measure the expression level of each gene using the comparative CT method. After normalization of each sample to the expression of the internal control VvActin1, the expression of each gene relative to the 14 DBF sample was calculated. Bars are standard errors of the means from three independent experiments.

