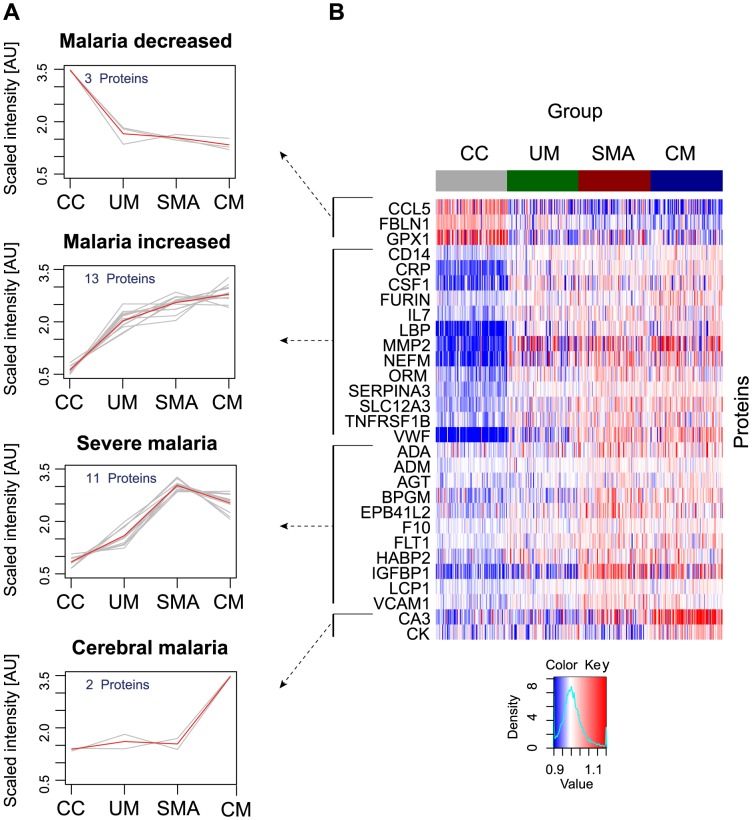
Figure 2. Identification of 29 human proteins discriminating community controls and malaria cases.
(A) Applying a non-parametric test, 29 human proteins were identified showing significant (adjusted p<0.001) differences between any of the four groups. Cluster analysis using self-organizing tree algorithm (SOTA) revealed four different clusters with distinct protein profiles designated as ‘malaria decreased’, ‘malaria increased’, ‘severe malaria’ and ‘cerebral malaria’ (see also Fig. S3 in Text S1). (B) Heatmap visualizing protein profiles in individual patients. Samples were organized according to group affiliation and proteins were sorted following SOTA clusters. Displayed are scaled relative intensities of each protein in each group (CC = grey, UM = green, SMA = red, CM = blue).

