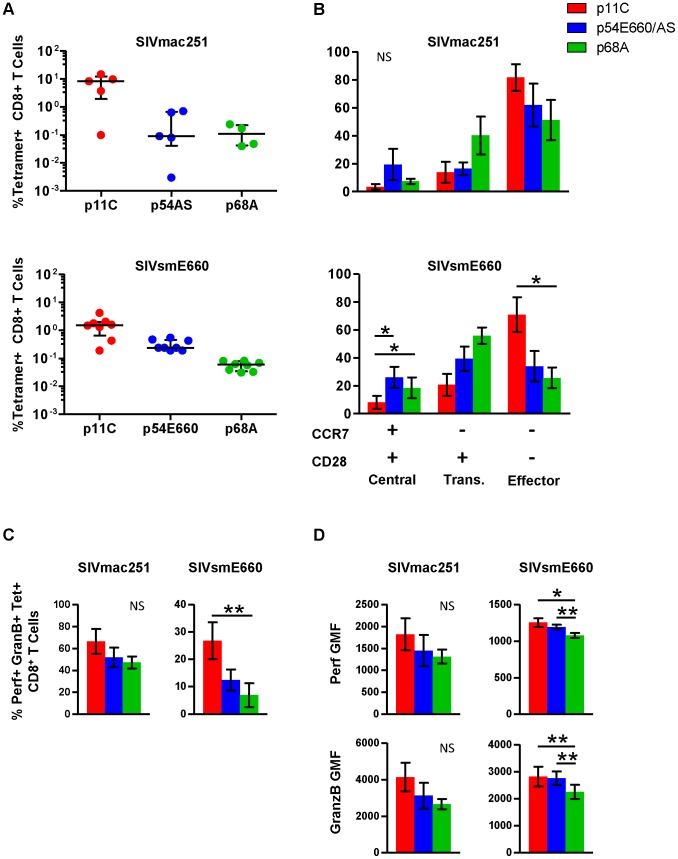
Figure 3. Phenotype and cytotoxic potential of dominant and subdominant epitope-specific cells during chronic SIVmac251 and SIVsmE660 infection.
The frequency, cell surface phenotype, and ex vivo perforin and granzyme B content were evaluated for p11C-, p54AS/E660-, and p68A-specific cells, identified with Mamu-A*01 tetramers, from peripheral blood of chronically infected SIVmac251- and SIVsmE660- infected rhesus monkeys. A) Frequencies of the p11C-, p54AS/E660-, and p68A-specific cells from (top) SIVmac251- and (bottom) SIVsmE660- infected rhesus monkeys. Error bars indicate median ± interquartile range. SIVmac251 frequencies measured between weeks 37–50, except for 133-06 which died early and data presented are from week 18. SIVsmE660 frequencies are measured between weeks 19–22. B) Phenotyping of cells from SIVmac251- (top, n = 4) and SIVsmE660-infected monkeys (bottom, n = 8) based on cell surface expression of CCR7 and CD28. Positivity for CCR7 and CD28 is indicated by the + and − signs below the bar graph. Cells were categorized as central memory (CCR7+CD28+), transitional memory (CCR7−CD28+), or effector memory (CCR7−CD28−). All tetramer-positive cells were CD95+. Phenotyping was conducted between weeks 44–78 for SIVmac251 and 33–46 for SIVsmE660. C) Measurement of percent of ex vivo perforin+granzyme B+ cells from SIVmac251- (Left, n = 5) or SIVsmE660-infected monkeys (right, n = 8). D) Per-cell expression of perforin and granzyme B, measured by geometric mean of fluorescence (GMF) of perforin and granzyme B staining on cells from SIVmac251- (left, n = 5) and SIVsmE660-infected monkeys (right, n = 8). Perforin and granzyme B measurements were conducted between weeks 63–83 for SIVmac251 and 41–49 for SIVsmE660. In parts B–D, error bars represent mean ± SEM. * and **, significant at p≤0.05 and 0.01, respectively, after Bonferroni correction. NS, not significant.

