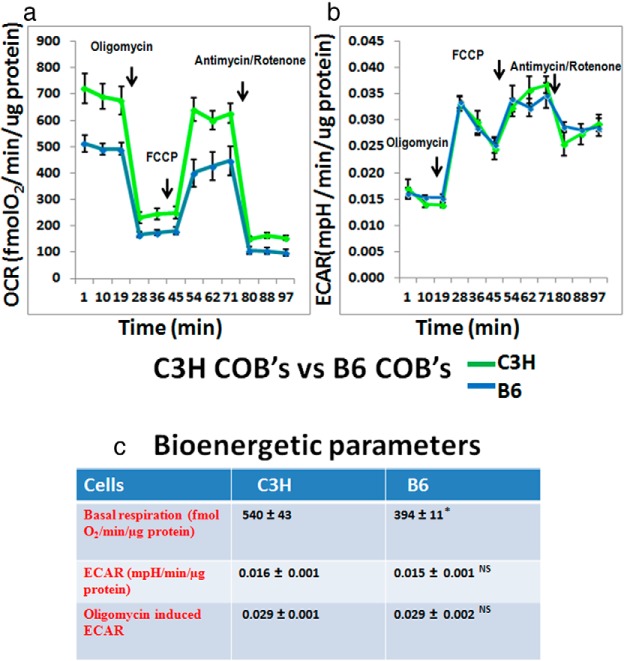
Figure 2.
Comparison of C3H vs B6 calvarial osteoblasts OCR (panel a) and ECAR (panel b) profiles of C3H and B6 calvarial osteoblasts that have undergone the Mito Stress test; this is representative of 2 individual tissue culture experiments. Each data point represents 3 or more wells; arrows point to the injection of electron transport chain inhibitors. Oligomycin is injected after 3 basal OCR readings; next FCCP, an uncoupler, is injected, which leads to an increase in OCR; this is followed by injection with both antimycin A and rotenone, leading to inhibition of complex I and complex III of the electron transport chain. ECAR is shown as change in pH at the same time points when OCR readings are obtained. This is the basic set up for all the representative Mito Stress experiments that are shown in this paper. c, Metabolic parameters obtained from C3H and B6 cells cultured for 7 days in growth media, followed by Mito Stress test. All data are represented as ± SEM; P = 0.0008 for OCR; P = .6 for ECAR; and P = .9 for oligomycin-induced ECAR (not significant). COB, calvarial osteoblast.

