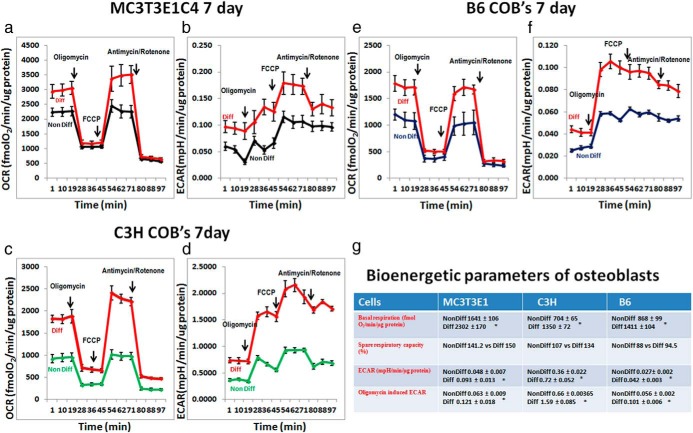
Figure 3.
Bioenergetics profile of MC3T3-E1C4, C3H, and B6 calvarial osteoblasts OCR (panel a) and ECAR (panel b) profile of MC3T3-E1C4 cells undergoing Mito Stress test comparing cells differentiated for 7 days in osteogenic media vs cells in regular media (50 000 cells per well). c and d, OCR and ECAR profiles of C3H calvarial osteoblasts that have undergone osteogenic differentiation compared with cells that were cultured in regular media. e and f, B6 calvarial osteoblasts undergoing Mito Stress test. g, Metabolic profile of each cell type from one individual; separate experiment the values obtained are an average of 3 individual time point, and each time point is an average of at least 3 individual wells. The data shown are representative of at least 2 individual differentiation assays on which the Seahorse Mito Stress experiments were performed. Assays for each cell line/strain were performed on separate plates; therefore statistical comparisons cannot be made between cell lines/strains. All data are represented as ± SEM and P < .05 compared with line/strain-matched nondifferentiated controls. COB, calvarial osteoblast.

