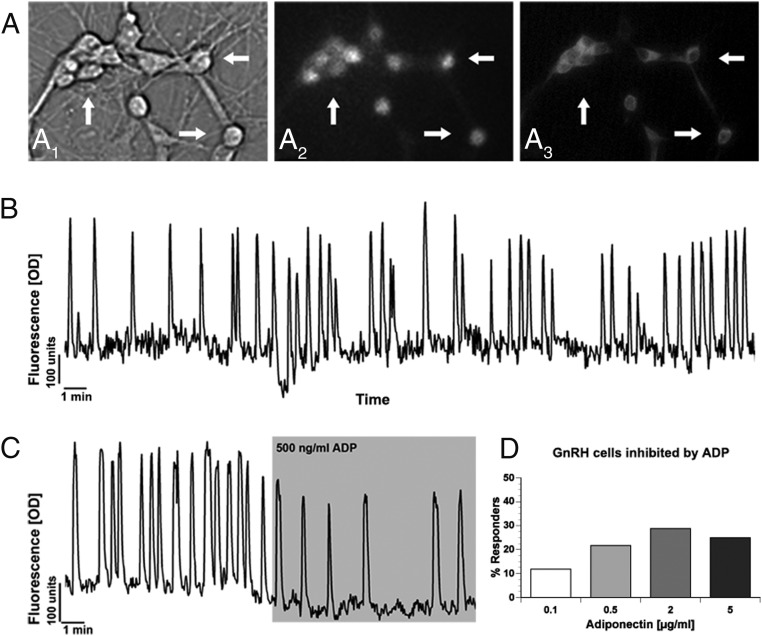
Figure 2.
ADP inhibits GnRH neuronal activity. A, Calcium Green-1 imaging of GnRH neurons. Cells were identified by their bipolar morphology (A1, bright field), loaded with fluorescent calcium-sensitive dye (A2, fluorescence), and their identity was verified after imaging by ICC (A3, immunofluorescence). Arrows indicate identical cells in all fields. B, Representative recording showing spontaneous baseline oscillations in intracellular calcium levels in a single GnRH neuron during 30 minutes in SFMs (Y-scale, OD units). C, Representative recording showing spontaneous baseline oscillations in intracellular calcium levels in a GnRH neuron during 10 minutes in SFM and subsequent decrease in activity during a 10-minute superfusion of ADP (500 ng/mL) (Y-scale, OD units). D, Concentration of ADP (0.1–5 μg/mL) vs the percent of GnRH cells that were inhibited.

