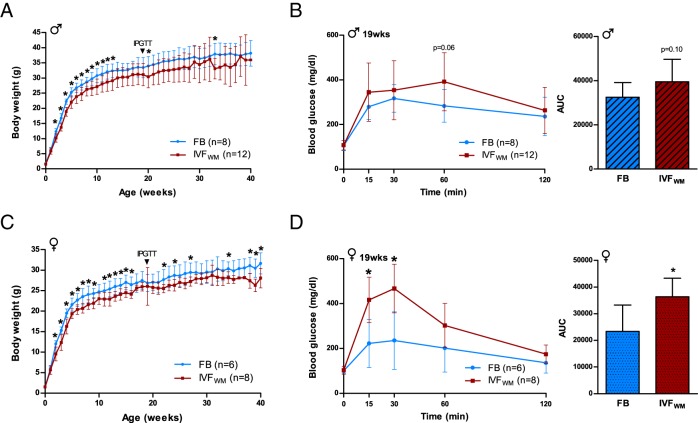
Figure 1.
Conception by IVFWM reduces growth and impairs glucose tolerance. A, Postnatal growth curves depicting average body weight for male FB (blue) and IVFWM (red) mice. B, Male IPGTT sampled at 19 weeks for clearance of a 1.5 mg/g glucose bolus over 120 minutes, with area under the curve (AUC) calculated from total glucose levels measured during the entire IPGTT course. C, Postnatal growth of female FB and IVFWM animals, and (D) female IPGTT sampled in tandem with males. For all measurements: FB males, n = 8; IVFWM males, n = 12; FB females, n = 6; IVFWM females, n = 8. Error bars depict SD. *, P < .05.

