
Figure 3.
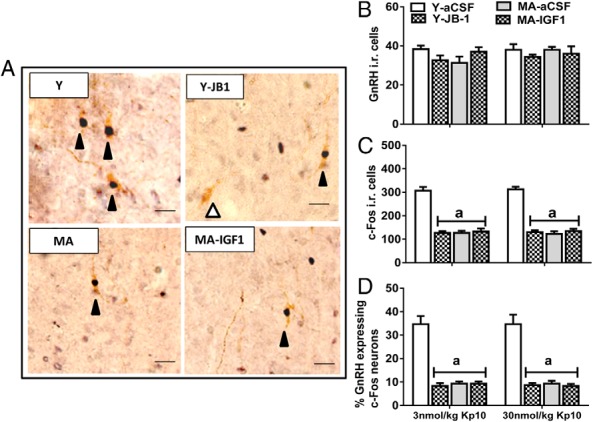
Kp10-induced GnRH neuron activation. A, Representative photos for c-Fos-ir (black arrowhead) and negative (white arrowhead) in GnRH neurons (scale bar, 10 μm, magnification, ×40). B, Number of GnRH immunopositive cells. C, Number of c-Fos-ir cells. D, Percentage of GnRH neurons coexpressing c-Fos. Values are shown as means ± SEM (n = 3). a, P < .01 vs Y-aCSF.