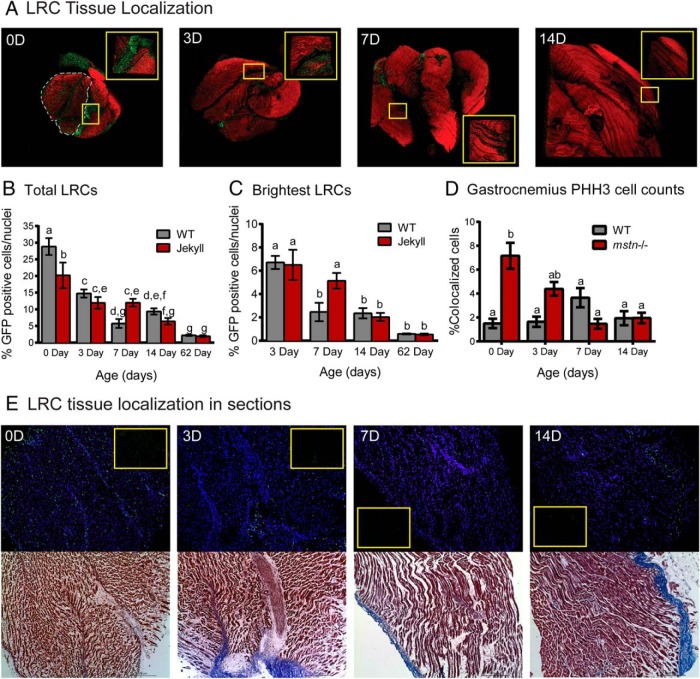
Figure 2.
Skeletal muscle LRCs. A, Three dimensional confocal images of whole gastrocnemius (×50) constructed using Metamorph software. Tissues were sampled from 0-, 3-, 7-, and 14-day-old pups (0 day old, 0D, etc; red, phalloidin-stained actin; green, LRCs) pulsed from E0.5 to E14.5. Inset images (×250) correspond to areas within yellow boxes. The greater head is outlined in the 0-day (0D) image and all tissues are oriented with the cranial end on top. B and C, The number of total and brightest LRCs was normalized to total nuclei and quantified in tissues sampled on the indicated days (n = 5–11/group). D, The number of GFP-positive cells also positive for PHH3 was quantified in tissues sampled on the indicated days (n = 3/group). In each histogram, different letters indicate statistical significance (P ≤ .05) between any particular group whereas the same letters indicate no differences. E, Sections of gastrocnemius were stained with DAPI (blue nuclei) and counterstained with Masson's trichrome stain (bottom, red muscle and blue connective tissue) before imaging at ×100. The top panels are of DAPI/GFP-merged images; inset are GFP only.

