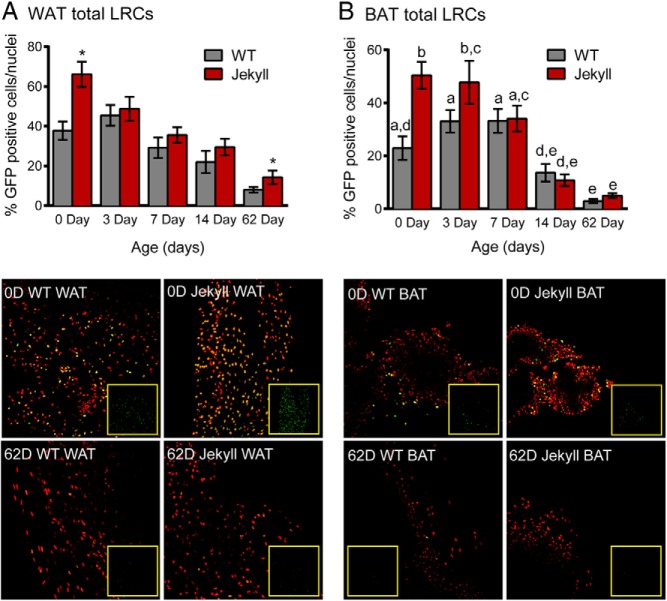
Figure 6.
Adipose tissue LRCs. A, Inguinal WAT was removed from mice on the indicated days and LRCs were quantified (histogram) and normalized to total nuclei stained with propidium iodide (red). Inset images are of GFP only and correspond to the surrounding merged nuclei/GFP image. Significant differences between WT and mstn−/− mice are indicated by asterisks (P ≤ .05, n = 5–11/group). B, BAT LRCs were similarly quantified and imaged. Different letters indicate statistical significance between any group, whereas the same letters indicate no differences.

