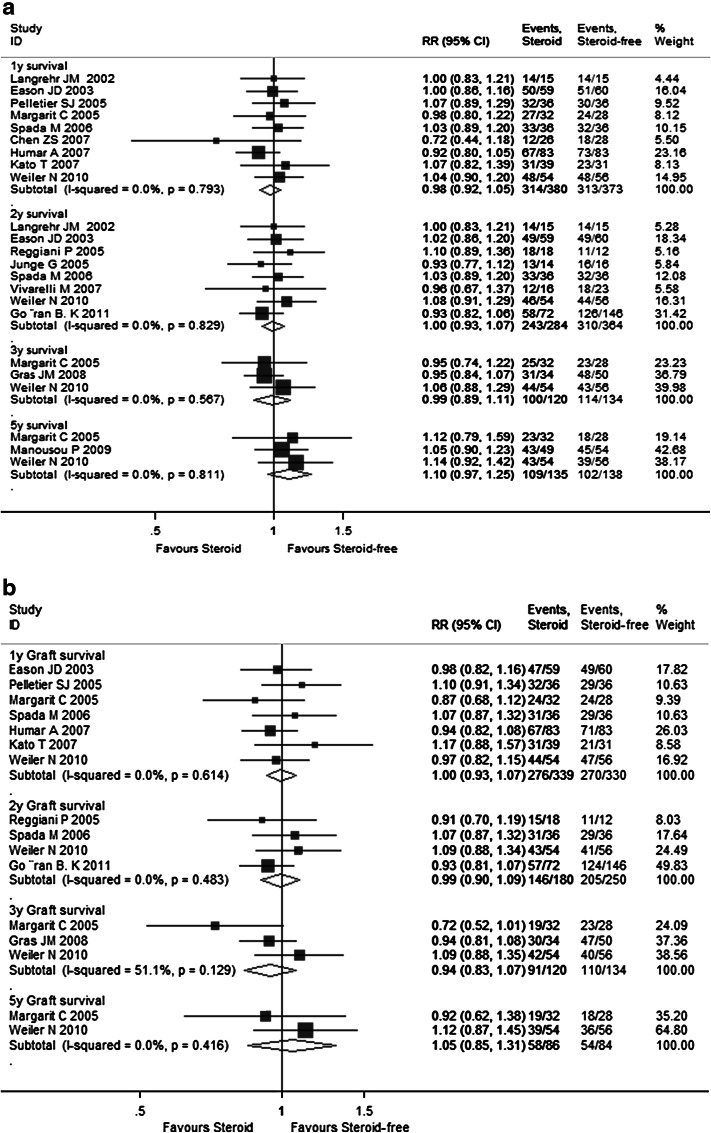
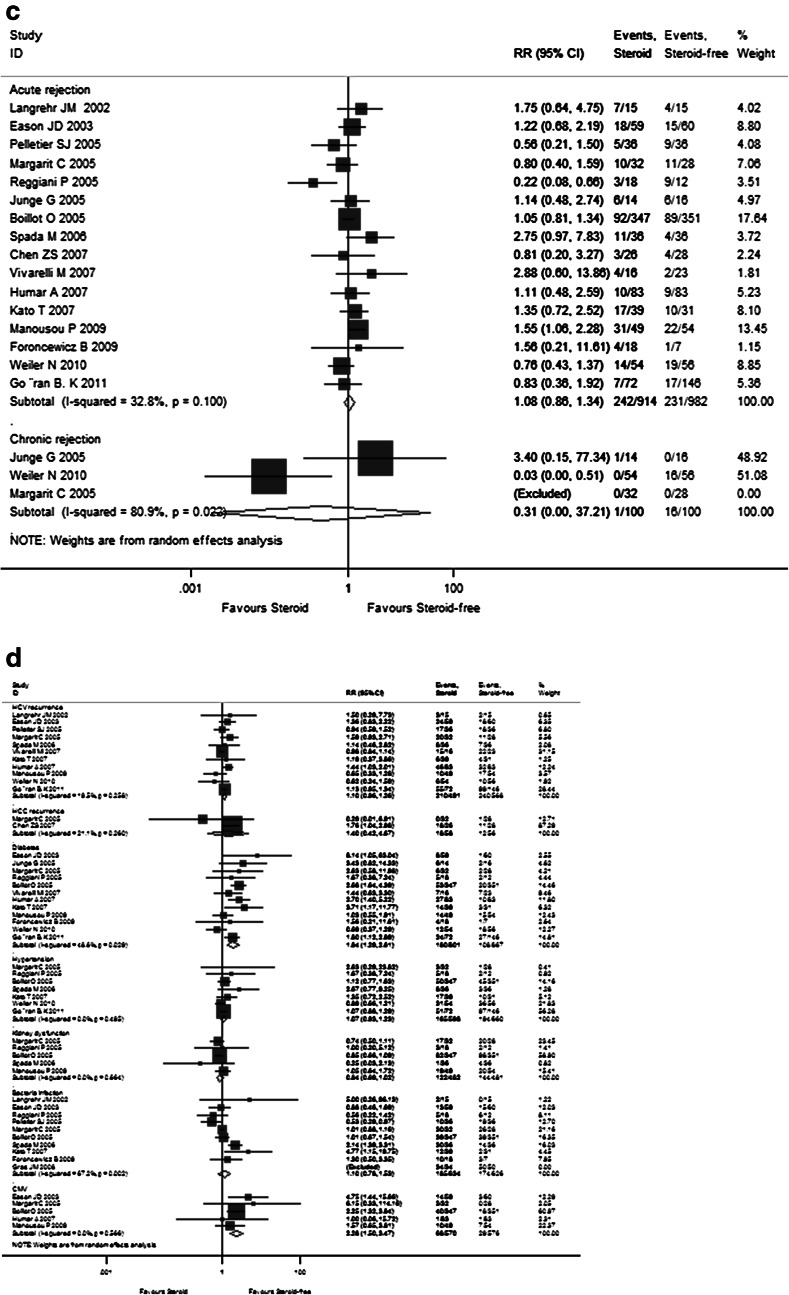
Fig. 2.
Forest plot of RR and 95 % CI for patient survival rates (a), graft survival rates (b), and rejection rates (c) and incidence of complications (d) for all 17 enrolled RCTs in this study. The horizontal lines represent the 95 % CI of the RR for the steroid group compared to steroid-free group in each study. The black box in the middle of the CI represents the single best estimate of RR in that study. The width of the CI is related to the power of the study and inversely associated with sample size. In addition, the pooled or combined RR results of the meta-analysis are represented by a diamond, the width of which is the CI for the pooled data. The vertical line is typically displayed to indicate no effect when RR = 1. When the CI crosses the vertical line of no effect, we must accept the null hypothesis of no difference between two groups. Only if the CI remains clear of the vertical line of no effect can we reject the null hypothesis and conclude that steroid minimization likely caused the outcome. We used a fixed effect model for meta-analysis, except that heterogeneity between studies was considered present if the p value was <0.1 or I 2 was more than 50 %, where we used a random effect model instead


