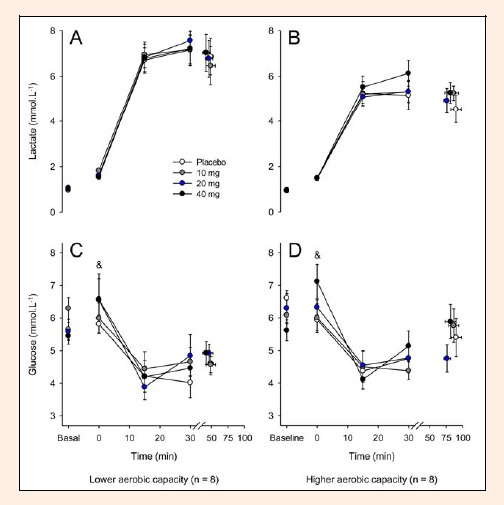
Figure 8.

Plasma lactate and glucose concentrations recorded at rest, at 15-min intervals during exercise and at the voluntary termination of exercise by subjects with lower (A and C) and higher (B and D) aerobic capacity. Each subject participated in four experimental trials with the following drug conditions: placebo and 10, 20 and 40 mg of paroxetine. The data are expressed as the mean ±SEM. & denotes that the results of the 40 mg paroxetine trial were significantly different from those of the 10 mg of paroxetine and placebo trials (p < 0.05).
