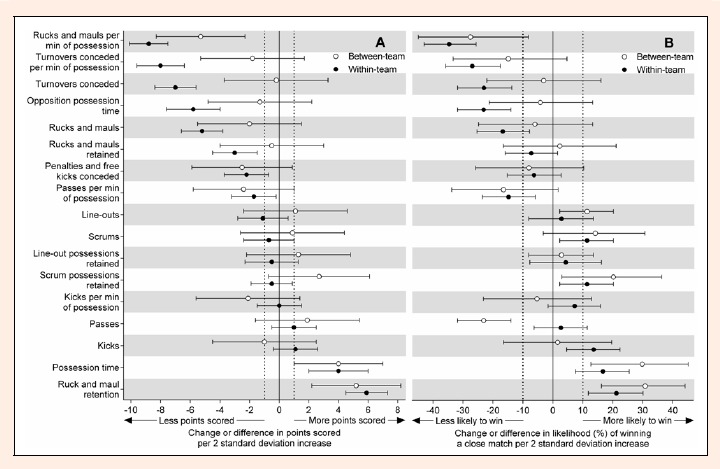
Figure 1.

Effect of two standard deviations of within-team changes and between-team differences of team performance indicators on (A) points scored during an international rugby sevens match, and (B) likelihood of winning a close match. Bars are 90% confidence intervals. Dotted lines represent thresholds for smallest meaningful difference: (A) ±1 point and (B) ±10%. Where error bars simultaneously cross the negative and positive values of the smallest meaningful difference, the effect is unclear.
