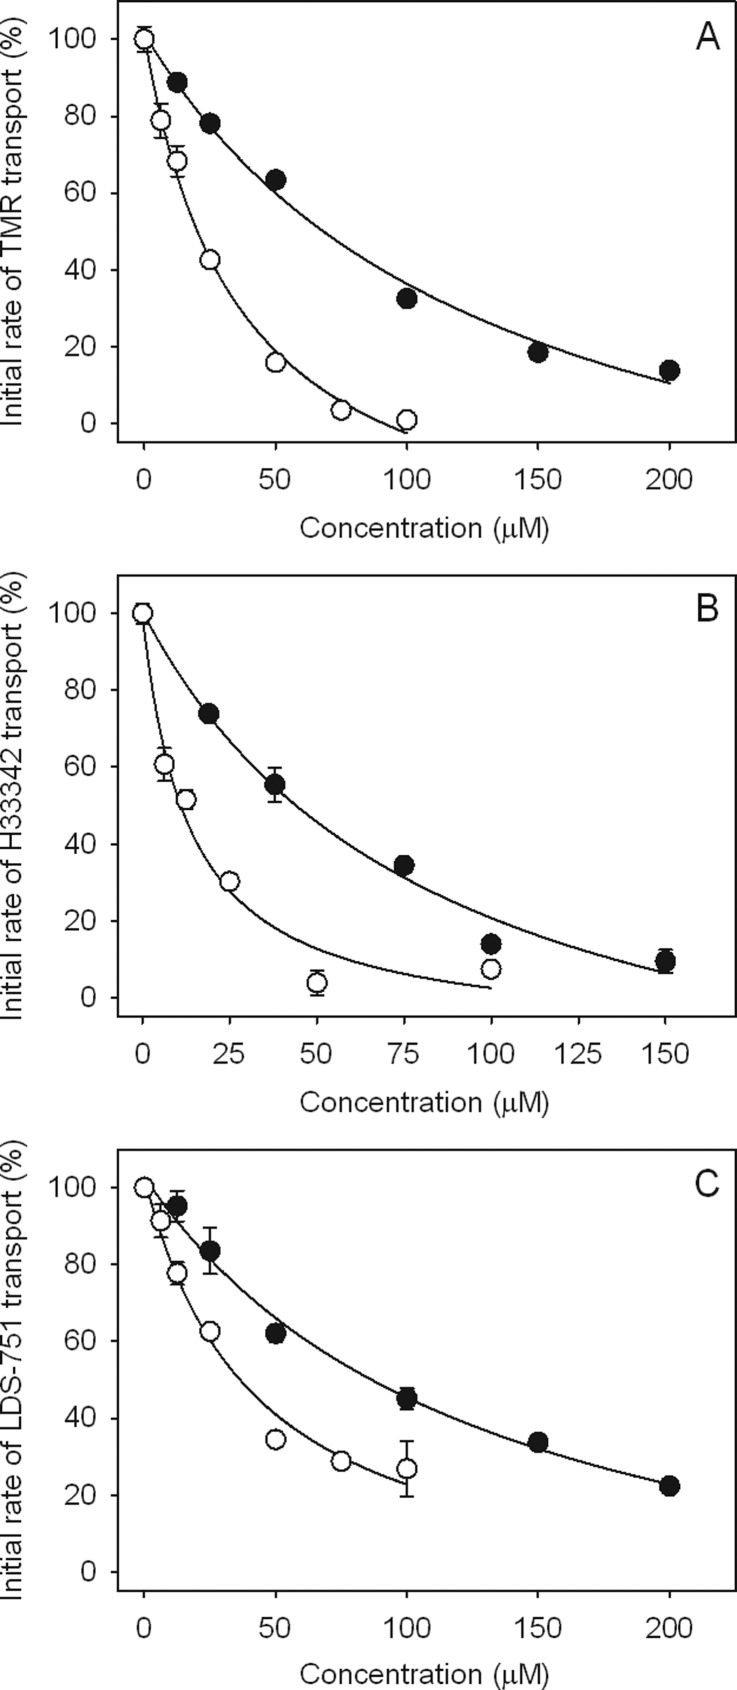
Figure 4.
Concentration-dependent inhibition of transport of (A) TMR, (B), H33342, and (C) LDS-751. QT (●) and QT2C2Me2 (8) (○). Results are shown for representative experiments with each data point carried out in duplicate. Where error bars are not visible, they are contained within the symbols. Inhibition plots were derived from real-time fluorescence data as described in Methods.

