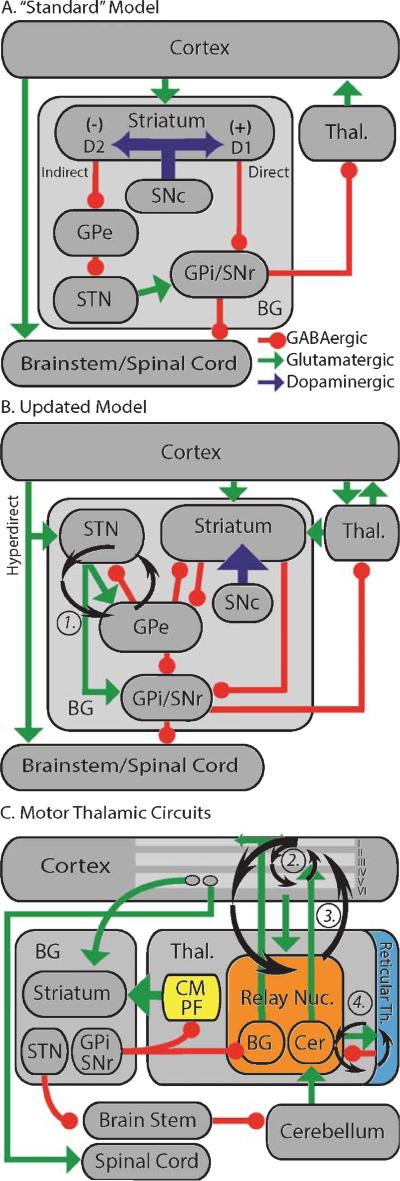
Fig. 1.
Cortical-BG-thalamic models (see Functional Anatomy for full descriptions). (A) The “standard” model. Green/light gray arrows–excitatory (glutamatergic) projections; red/black circles–inhibitory (GABAergic) projections; blue/dark gray arrows –dopaminergic projections. (+) and (–) indicate excitatory and inhibitory effects of dopamine on MSNs, respectively. Abbreviations are defined in the text. (B) Updated model. Not all connections described in the text are illustrated for clarity. (C) Model emphasizing thalamic circuits. Roman numerals indicate cortical layers. Ovals in layer V indicate distinct populations of IT and PT neurons. Note the distinct projection patterns of the cerebellar and BG-recipient thalamus. In the thalamus, “BG” and “Cer” indicate the BG and cerebellar-recipient regions, respectively. Circular arrows in (B) and (C) indicate candidate oscillation generators.

