
Figure 2.
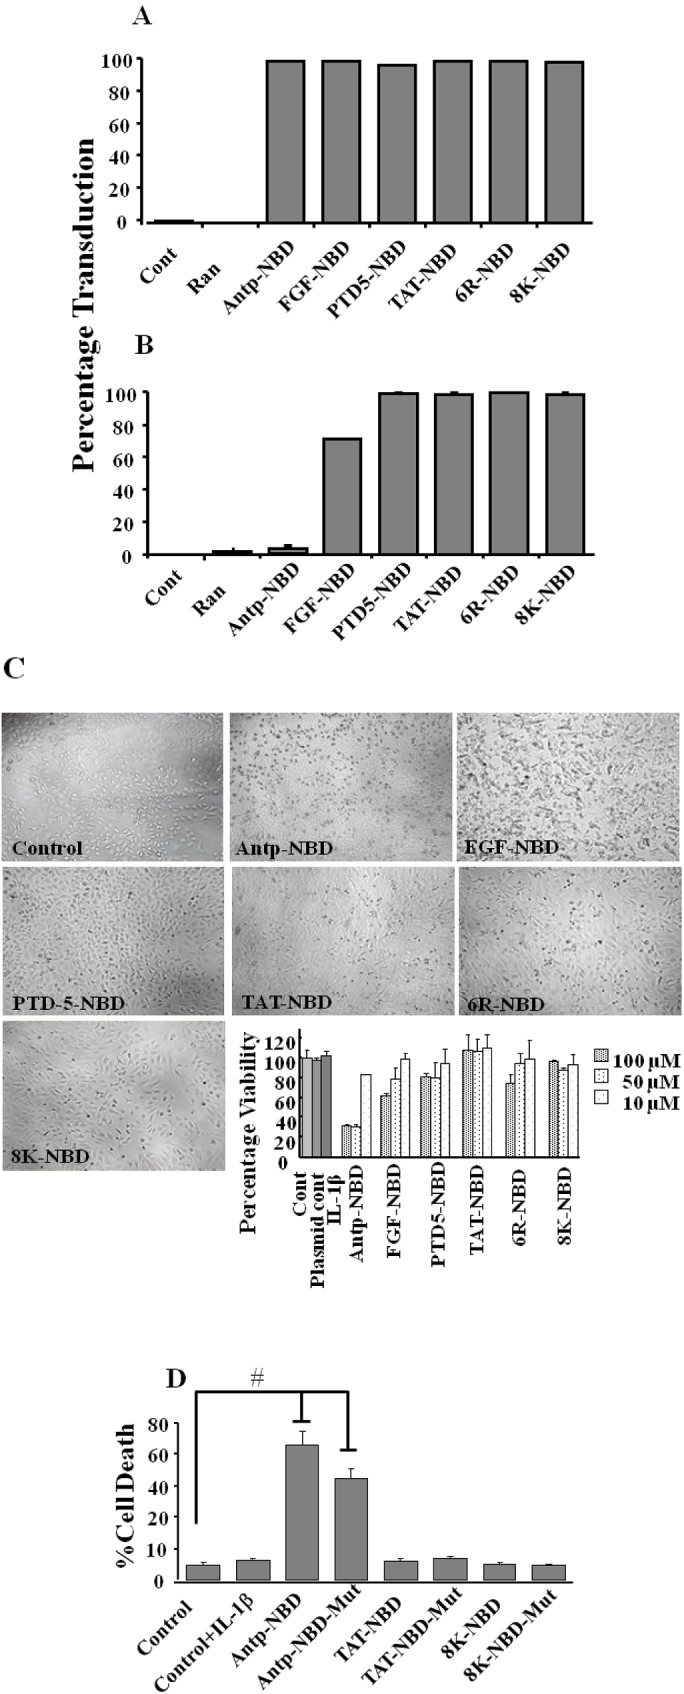
Transduction efficiency of PTD-NBD peptides. Figure showing FACs analysis of HeLa cells after 1 h of incubation with 6CF control peptide (random) or 6CF-PTD-NBD peptides. Cells were treated for 1 h with either 10 or 100 µM of fusion peptides as indicated. Cells positive for 6CF were analyzed and the % of positive cells graphed (Panels A and B). Cytoxicity of PTD-NBD peptides. HeLa cells were incubated with varying concentrations of PTD-NBD peptides, after 3 h incubation, cells were washed, evaluated by microscopy (Panel C) and viability was determined by MTT assay (panel C bar diagram; panel D). # P < 0.001.