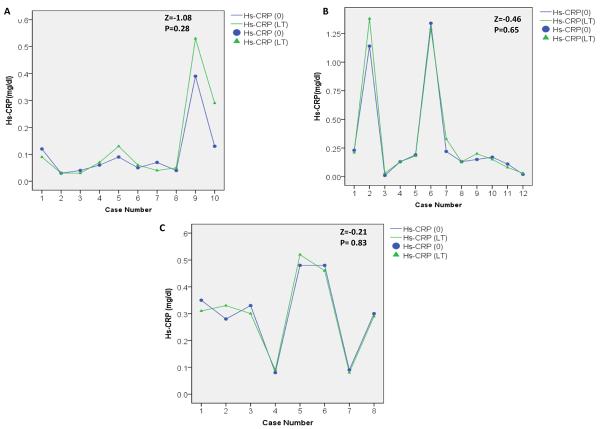
Figure 2. Change in serum Hs-CRP concentrations measured at baseline and after long-term storage based on the time elapsed between sample collection and Hs-CRP (0) test.
(_) green line represents serum HS-CRP variation at baseline among the study participants.
(_) blue line represents serum HS-CRP variation at after long term storage among the study participants.
(▲) green triangle represents serum Hs-CRP at baseline for each study participant and (•) blue dot represents serum Hs-CRP after long-term storage for each study participant.
(A) Samples assayed between 0–8 days after collection (n=10). (B) Samples assayed between 9–80 days (n=12) and (C), samples assayed more than 80 days after collection (n=8). Z, Wilcoxon signed rank test statistics, P is p-value.

