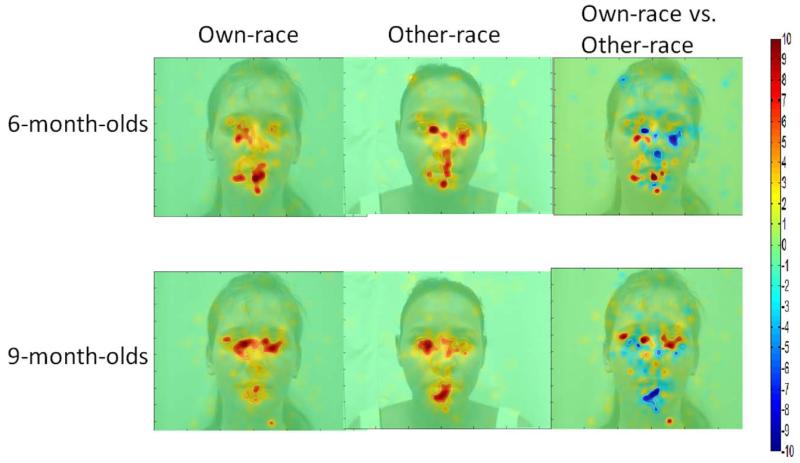
Figure 1.
Raw fixation maps for viewing own-race faces (first column), other-race faces (second column), and the difference between viewing own- versus other-race faces (third column) in 6-month-olds and 9-month-olds. The colors represent Z-scores of the fixation duration, with warmer colors denoting longer fixation duration. In the difference map, warmer colors indicate greater fixation time for own- than other-race faces, while cooler colors indicate greater fixation time for other- than own-race faces (p < .05, two-tailed, corrected).

