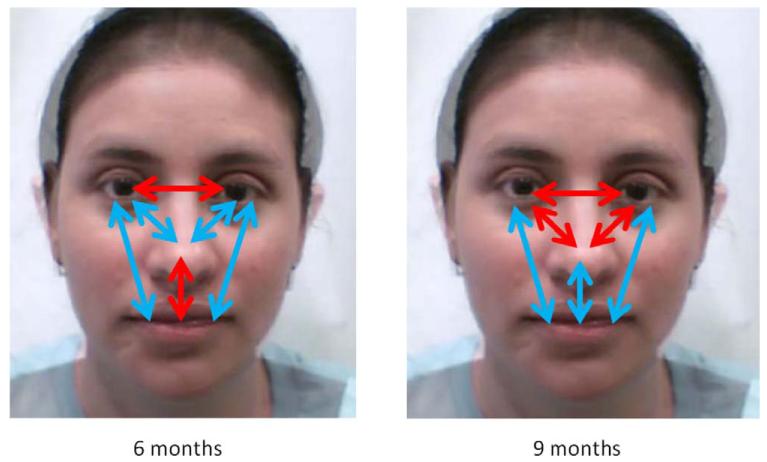
Figure 2.
Mean scan path maps for the difference between own- and other-race faces in 6- and 9-month-olds. The face shown is a morph of one Caucasian and one African face used in the experiment. The red line indicates more scan path counts in own- versus other-race faces. The blue line indicates more scan path counts in other- versus own-race faces.

