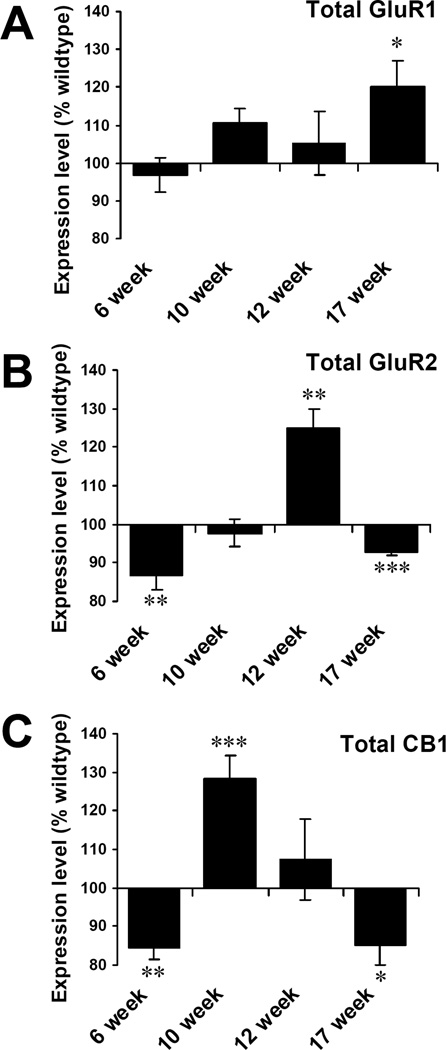
Figure 4. Time course changes of total receptor changes in G93A mice.
Levels of total expression in motor neurons of G93A mice are represented as percentages of wild type littermate controls of the same time points. (A) Total GluR1 increased significantly at 17 weeks. (B) Total GluR2 decreased at 6 weeks, then increased at 12 weeks. Finally total GluR2 decreased again at 17 weeks. (C) Total CB1 decreased early (6 weeks), increased at 10 weeks, and decreased at 17 weeks. Unpaired t test. *P<0.05, **P<0.01, ***P<0.001. Error bars represent SEM. N = 37–57 neurons analyzed from G93A and control mice for each time point.

