Figure 1.
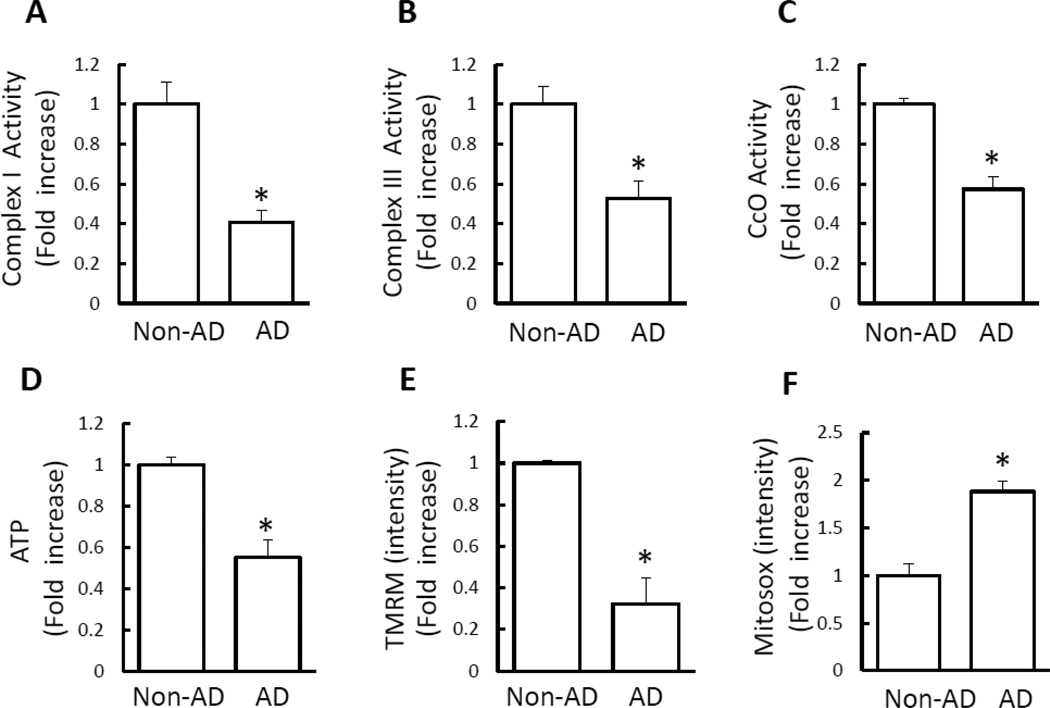
Mitochondrial dysfunction in AD cybrid cells. A–D) Enzymatic activity of complex I, III, and IV (CcO), and ATP levels were determined in cell lysates from indicated cell groups. E–F) Mitochondrial membrane potential and reactive oxygen species (ROS) were measured by TMRM (E) and Mitosox staining intensity (F), respectively. Image intensity was quantified using NIH Image J software. Data are expressed as fold increase relative to non-AD cybrid cells. N = 7 cell lines/group. * p<0.05 versus non-AD group.

