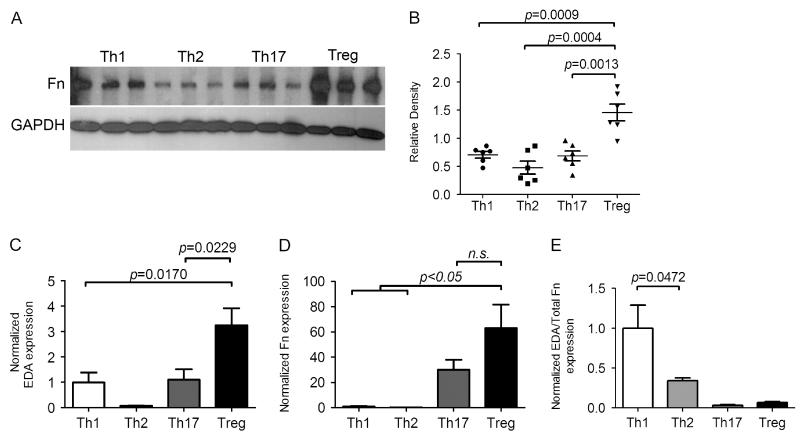
Figure 5.
Characterization of splenocyte production of fibronectin under conditions promoting specific Th lineages. (A) Detection of total fibronectin content in cell lysates from splenocytes cultured under conditions promoting Th1, Th2, Th17, or Treg conditions. Bands are representative of three independent cultures; GAPDH is shown as a loading control. Results shown are representative of six independent cultures for each condition. For a detailed description of culture conditions see the Materials and methods section. (B) Quantification of total fibronectin protein expression as relative band density of bands represented by panel A. (C–E) Real-time PCR quantitation of EDA cFN (C), total Fn (D), and EDA cFN/total Fn ratio (E), from splenocytes cultured under conditions promoting Th1, Th2, Th17, or Treg differentiation. Bars represent mean and SEM of six independent cultures.

