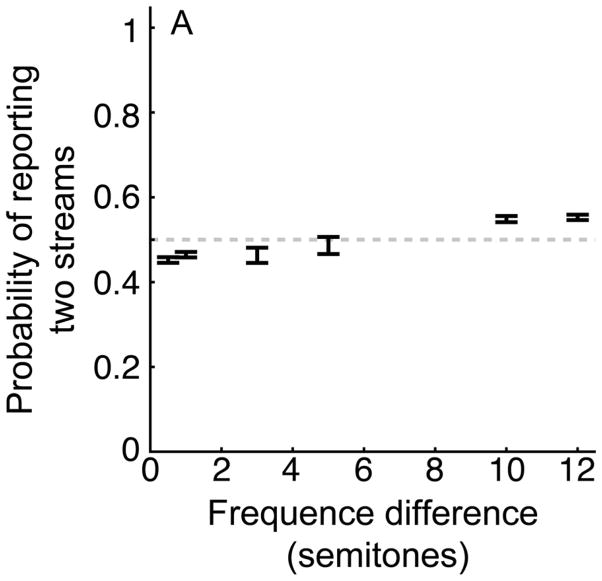
Figure 3. Behavioral performance: all data and all sessions.
The average performance of both monkeys from all of the behavioral sessions reported in this manuscript (except for those trials when tone A and B were presented simultaneously; see Fig. 7). The center of each bar indicates the average probability (i.e., the proportion of trials) that the monkeys reported two streams; the length of the bars indicates the 95% confidence interval. The gray dashed line represents chance performance (0.5) of answering one or two streams.

