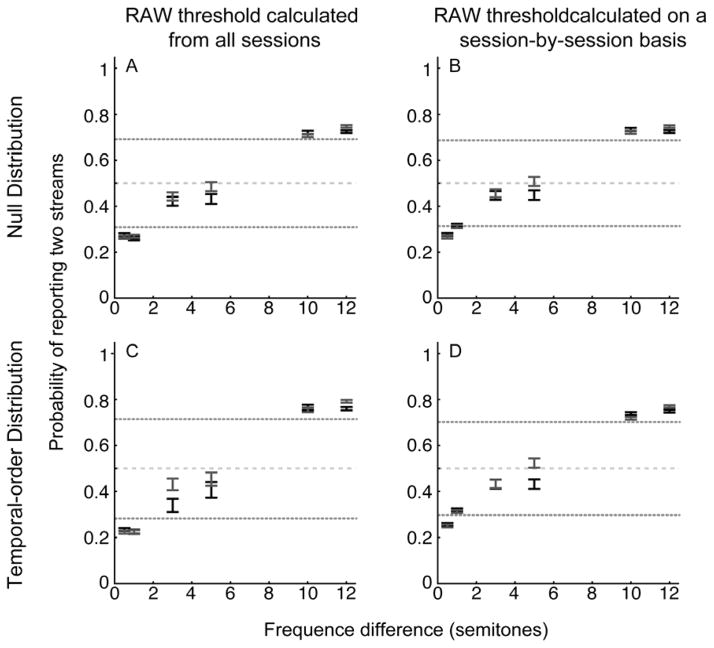
Figure 5. Behavioral performance: dependence on the frequency of tone A.
The data in each row and column are organized analogous to that in Figure 4. The dotted lines illustrate the upper and lower boundaries of the 20-trial RAW threshold; the other thresholds are not shown. The data in black indicate average suprathreshold performance when the frequency of tone A was relatively low (865–1500 Hz). The data in gray indicate average suprathreshold performance when the frequency of tone A was relatively high (1501–2226 Hz). The center of each bar indicates average suprathreshold performance; the length of the bars indicates the 95% confidence interval. If error bars from one color are not visible, it is because the confidence intervals for multiple conditions overlap completely. The gray dashed line represents chance performance (0.5) of answering one or two streams.

