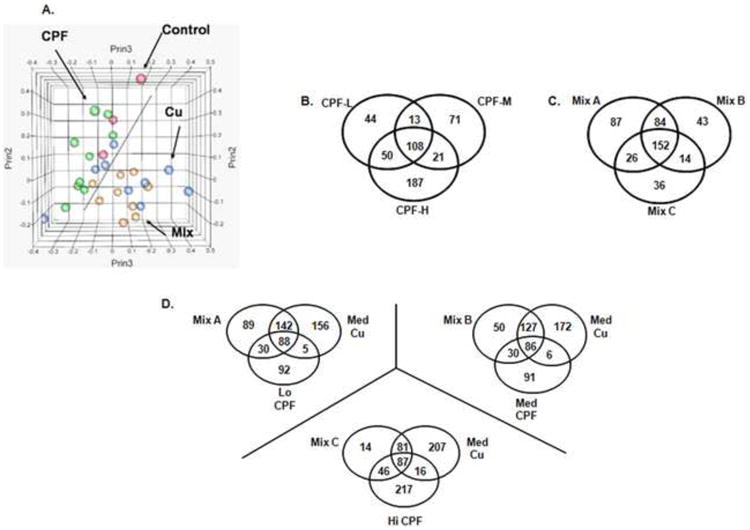
Figure 1. Principal component analysis (PCA), hierarchical clustering and Venn diagrams of chlorpyrifos (CPF), copper (Cu), and binomial mixture (Mix) microarray data.

A) PCA reduces a complex data set to a lower dimension that can reveal hidden, simplified structures in the data. Data from all genes on the array were included in the PCA and the three top principal components were used to generate the three dimensional figure shown. Red circles represent controls, green circles CPF, blue circles Cu, and yellow circles mixtures. PCA clearly separates the Cu exposed microarray data sets from those originating from the CPF exposures. This separation is partially obscured by the two dimensional representation of the three dimensional Figure 1A and the following description is intended to remedy this limitation. The data points representing Cu treatments (blue) move forward and to the lower right of the figure with increasingly higher doses, whereas the CPF data points (green) extend to the back and to the upper left of the figure. By contrast, the controls and the samples treated with the low Cu or low CPF concentrations congregate along the center dotted line. The mixture data points (gold dots) associated closer with the Cu treatments. B-D) Venn diagrams showing the number of shared genes between treatments significantly affected (p<0.05) in at least one treatment at >1.5 fold greater than controls. B) Between 213-366 total transcripts were perturbed by CPF at any one concentration, and 108 differentially expressed transcripts were shared between all three CPF concentrations. C) Although the mixtures altered the expression of a roughly similar number of transcripts (228-349 transcripts), the number of altered genes decreased as the concentration of CPF in the mixtures increased. The majority of altered transcripts were shared (152) among all three mixtures or between any two combinations. Each mixture exhibited a unique response which decreased as the concentration of CPF in the mixtures increased. D) Venn diagrams of mixture treatments compared to the signatures of individual constituents. Overall Mix A (upper left) and Mix B (upper right) have similar relationships between treatments while Mix C (bottom) differs.
