
Figure 2.
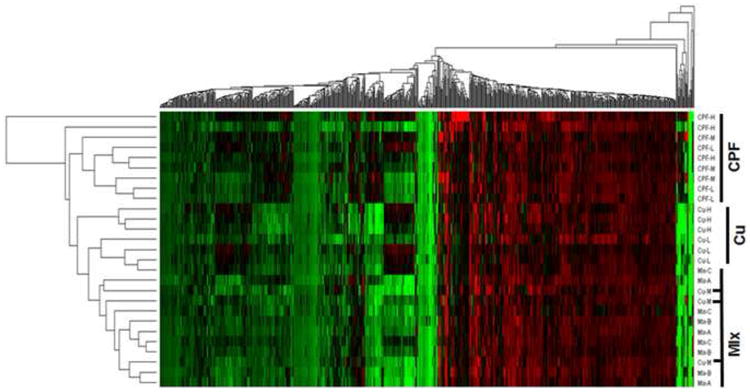
Hierarchical clustering of transcripts significantly changed (p<0.05 and ≥1.8 fold) vs. controls. The cluster labeled “Mix” contains the CPF and Cu mixture exposures and the three Cu-M (medium dose copper) samples are indicated with horizontal black lines.