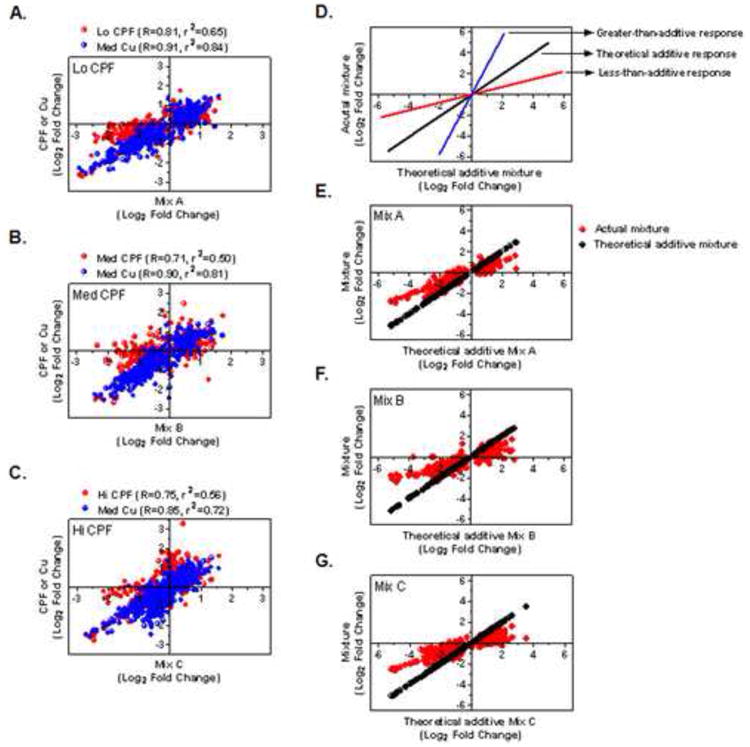
Figure 3. Correlations of gene profiles from each binomial mixture relative to individual components and to a theoretical expectation of response-addition.

Values are expressed as fold change (Log2) compared to vehicle-treated controls and were plotted to generate Pearson correlation coefficients (R) among treatments and least-squares linear regression (r2 values, p <0.0001). A) Mix A versus CPF-L or Med Cu, B) Mix B versus Med CPF or Med Cu, C) Mix C versus Hi CPF or Med Cu, D) theoretical additive, greater-than-additive, or less-than-additive response of the actual binomial mixtures relative to theoretical mixture values calculated from addition of each constituent, E) Mix A versus theoretical additive Mix A, F) Mix B versus theoretical additive Mix B, and G) Mix C versus theoretical additive Mix C. All binomial mixtures show a less-than-additive response.
