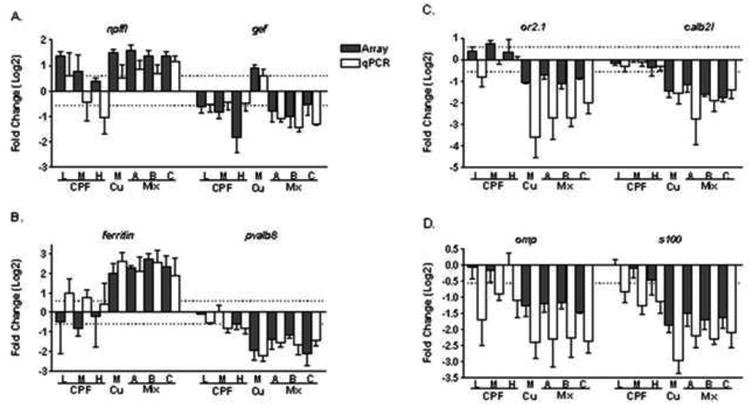
Figure 5. Quantitative real-time PCR confirmation of the microarray data.

Values are expressed as average fold change (Log2) with standard error compared to controls. The array response (shaded bars) for each treatment is grouped with the qPCR results (white bars) and the two methods compare favorably in both the direction and magnitude of the response. A) neuropeptide FF-amide peptide precursor-like (npffl) and neuronal protein gefiltin (gef); B) parvalbumin 8 (pvalb8) and a putative ferritin heavy chain (ferritin); C) calbindin 2, like (calb2l) and olfactory receptor 2.1 (or2.1); D) S100 protein (s100) and olfactory marker protein (omp). Dashed line across all data illustrates 1.5-fold change from controls.
