
Fig. 8.
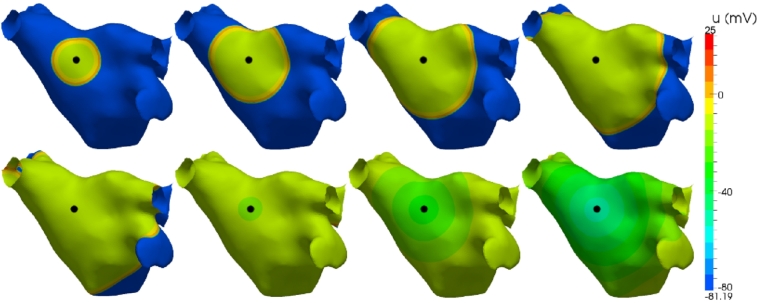
Electrical propagation across an atrium from a circular stimulus in the left-superior wall (black dot). Images show transmembrane voltage at 20 ms, 40 ms, 60 ms and 80 ms (top row), and 100 ms, 150 ms, 200 ms and 250 ms (bottom row) after initial stimulus. (For interpretation of the references to colour in this figure, the reader is referred to the web version of this article.)