
Fig. 10.
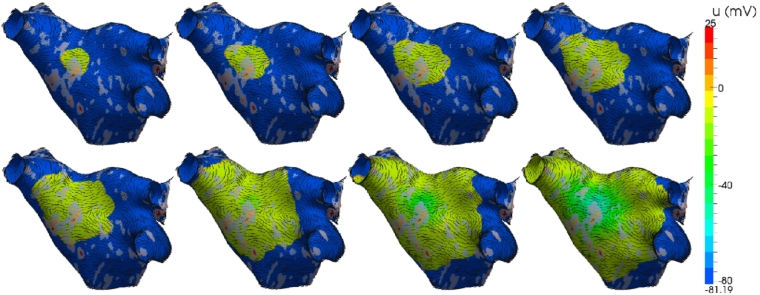
Electrical propagation across the atrium, incorporating scar information and fibre orientation, from a circular stimulus in the left-superior wall. Images show transmembrane voltage at 20 ms, 40 ms, 60 ms and 80 ms (top row), and 100 ms, 150 ms, 200 ms and 250 ms (bottom row) after the initial stimulus.