. 2011;3(1):22–35.

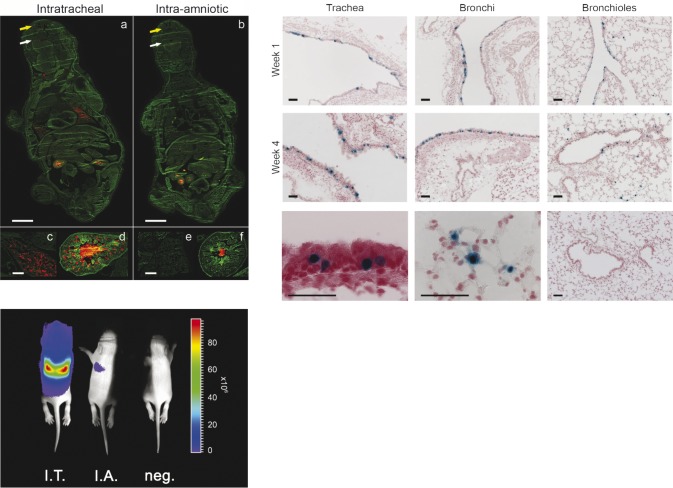
Fig. 7. Upper left: Comparison of efficiency of intrapulmonary delivery between intratracheal (I.T.) versus intra-amniotic (I.A.) injection at E18 (term E19.5) using red fluorescent microspheres on whole body sections (a,b). Animals were sacrificed 24 h after injection. Fluorescent microspheres are present in the oral (white arrow) and nasal (yellow arrow) cavity, in the fetal lung (c,d) and gastro-intestinal tract (d,e) after I.T. and I.A. injection, respectively. a,b, Bar = 2 mm; c–f, bar = 200 µm. Bottom left: Non-invasive bioluminescence imaging of firefly luciferase expression after rAAV2/6.2 mediated gene delivery (3 × 1010 GC/fetus) in the fetal mouse lung. BLI signal is illustrated at 1 week post injection. The pseudocolor scale depicts the photon flux per second, per square centimeter per steradian (p/s/cm2/sr). Upper right: rAAV2/6.2-mediated transgene expression in murine airway epithelium after fetal I.T. injection of rAAV2/6.2 (3 × 1010 GC/fetus). Representative images of different lung regions are given at 1 and 4 weeks after fetal I.T. injection, respectively, showing the trachea, the bronchi and the bronchioles with the alveoli. A high magnification image depicts β-gal positive ciliated (bottom left image) and alveolar cells (bottom middle image) at week 1. Absence of reporter gene expression in a control lung (bottom right image). Bar = 50 µm. Figure adapted from Carlon et al., 2010.

Fig. 7