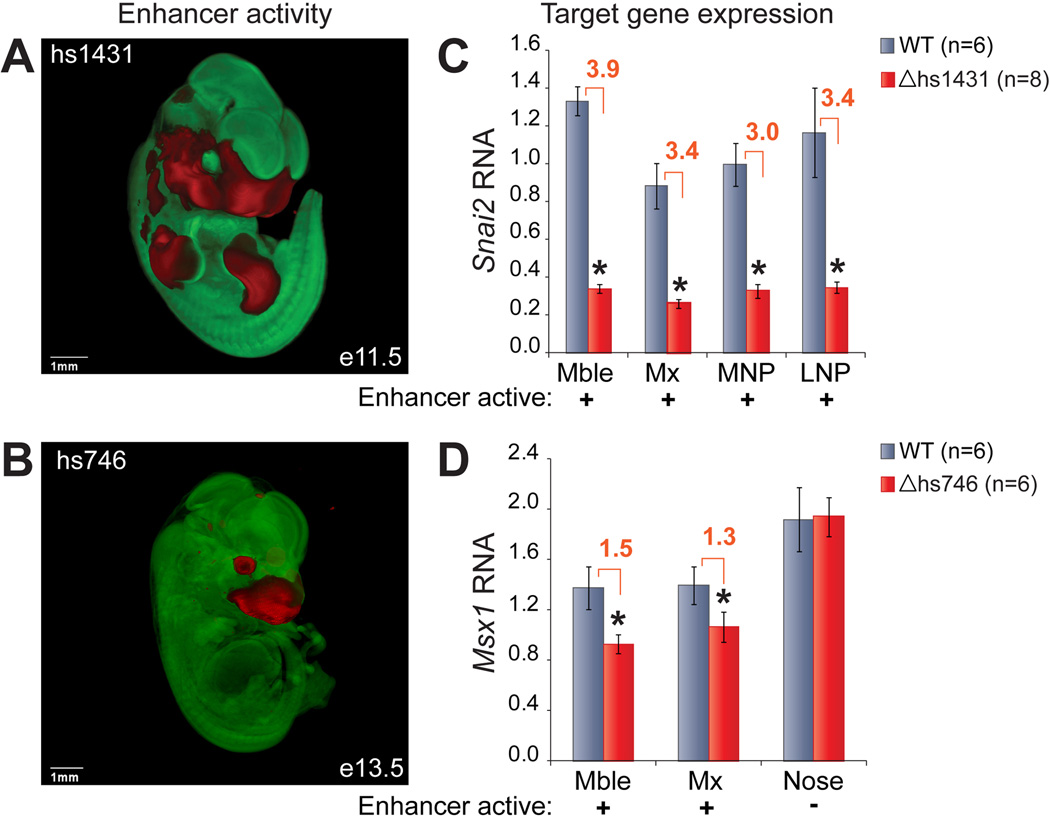
Fig. 6. Expression phenotypes resulting from craniofacial enhancer deletions.
(A, B) In vivo activity pattern of hs1431 (at e11.5) and hs746 (at e13.5). OPT data is represented in red (LacZ, enhancer active) and green (no LacZ, enhancer inactive). (C, D) Expression levels of enhancer target genes in craniofacial tissues dissected from wild-type (gray) and knockout (red) littermate embryos. Error bars show the variation among individuals of the same genotype (SEM). *, P < 0.05 (Student T-test, 1-tailed); Mble, mandibular; Mx, maxillary; MNP, medial nasal process; LNP, lateral nasal process.

