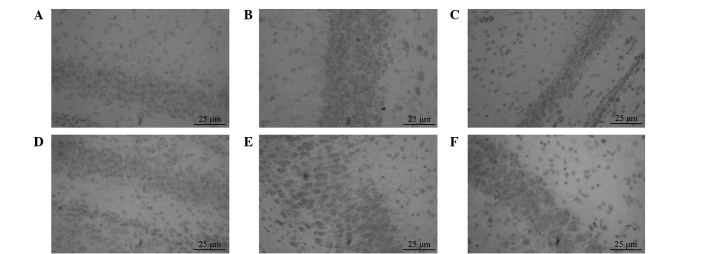
Figure 2.

Rat hippocampal tissue expression levels of TNF-α in the (A) sham, (B) model and (C) PROG groups, and NF-κB in the (D) sham, (E) model and (F) PROG groups. TNF-α, tumor necrosis factor-α; NF-κB, nuclear factor-κB; PROG, progesterone. Magnification, ×400; streptavidin-biotin complex (SABC) staining.
