Figure 4.

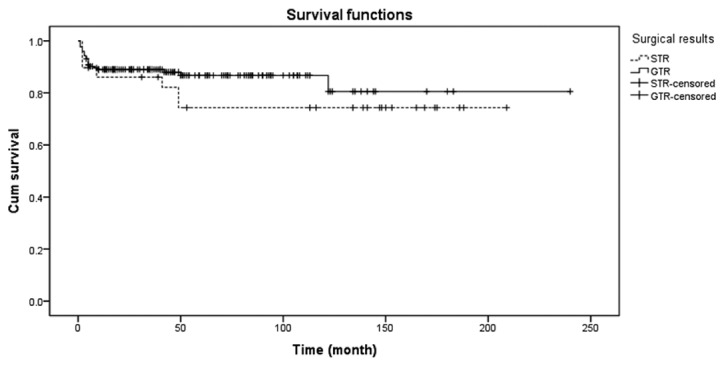
Long-term survival rate curves of GTR and STR patients. (Logrank test, 4.194, P<0.05). GTR, gross-total resection; STR, subtotal resection.

Long-term survival rate curves of GTR and STR patients. (Logrank test, 4.194, P<0.05). GTR, gross-total resection; STR, subtotal resection.