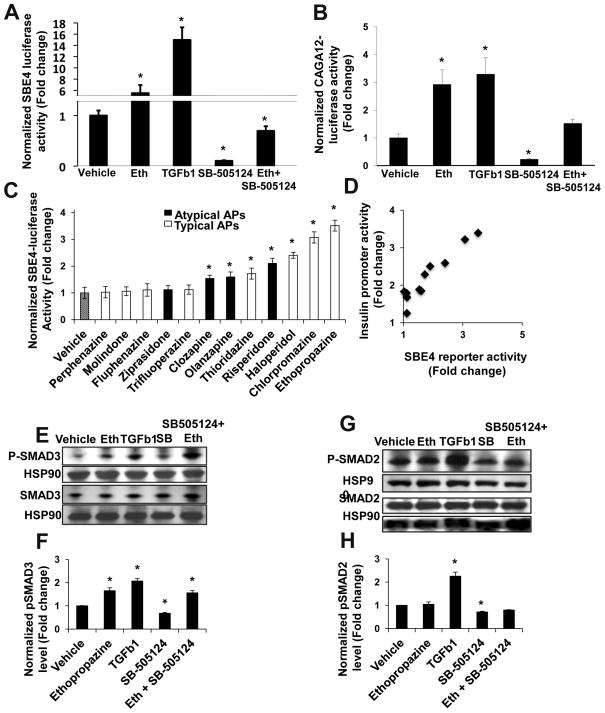
Figure 2. Antipsychotics activate the TGFβ pathway through enhancement of SMAD3, but not SMAD2, activity.
(A, B) Ethopropazine increases activity of the SMAD2/3 responsive SBE4-luc reporter (A) and the SMAD3 specific CAGA12-luc reporter (B). Cells were treated for 24 hr with the indicated condition before harvesting for luciferase assay. (n≥6). (C) SAR of typical and atypical antipsychotics on the SBE4-luc reporter. (n≥6). (D) SBE4 reporter activity of antipsychotics from 2C is plotted against the insulin promoter activity from Figure 1A. Each point represents a single antipsychotic (Pearson correlation coefficient = 0.93, p=0.00012). (E,G) Immunoblot analysis of phospho-SMAD levels. T6PNE cells were treated for 1hr with the indicated condition and a Western blot was performed with antibodies towards total and pSMAD3 (E) or total and pSMAD2 (G), and HSP90. (F, H) Quantification of pSMAD3 (F) and pSMAD2 (H) protein levels demonstrated that antipsychotics increased pSMAD3 but not pSMAD2. The pSMAD intensity was divided by the total SMAD intensity (n=3, blot shown is representative of 3 independent experiments). Error bars are SEM. * indicates p<0.05 relative to DMSO control.

