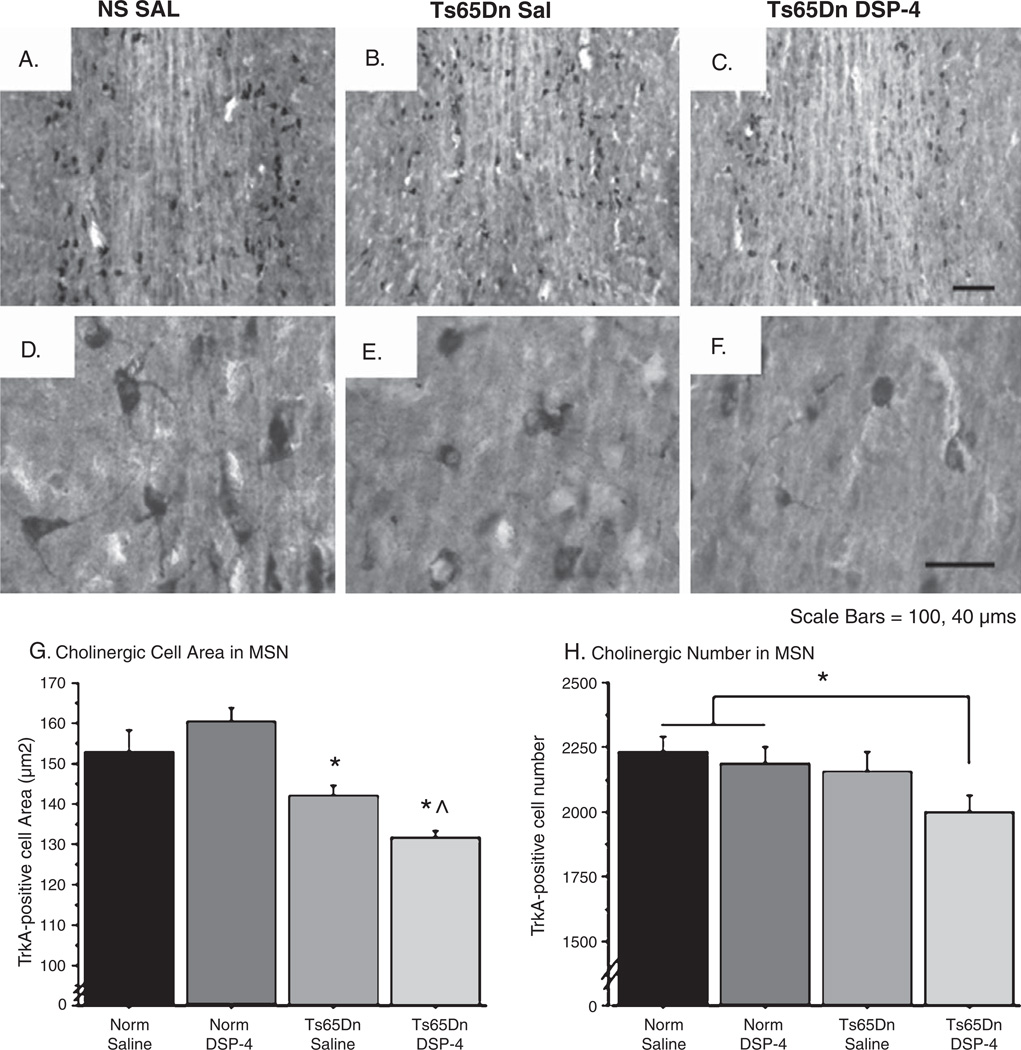
Fig. 8.
Reduced cell size and number of BFCNs in Ts65Dn mice after DSP-4 administration. A–F) TrkA-positive cholinergic neurons in the MSN are shown in NS Sal (A, D), Ts65Dn Sal (B, E), and Ts65Dn DSP-4 (C, F) at 20× and 40×, respectively. Cell body atrophy was observed in Trk-A I.R. neurons in Ts65Dn mice (E), which was further exacerbated by the DSP-4 lesion (F). Also note that TrkA-I.R. cells in both Ts65Dn gropus exhibit fewer processes and less robust labeling with the TrkA antibody overall. G) Cell size measurements confirmed that Ts65Dn DSP-4 average cell area was significantly lower than in all other groups, including Ts65Dn Sal mice. H) Stereology of TrkA-positive neurons in the MSN depicted a significant reduction in the number of neurons in Ts65Dn DSP-4 mice compared to NS mice (mean ± SEM, *p < 0.05 relative to NS Sal, ^p < 0.05 relative to Ts65Dn Sal).

